ISSN
2307–3489 (Print), ІSSN
2307–6666
(Online)
Наука
та прогрес транспорту. Вісник
Дніпропетровського
національного університету залізничного
транспорту, 2017,
№
1
(67)
залізнична
колія
залізнична
колія
UDC
656.224-026.512.1
M. B. KURHAN1,
D. M. KURHAN2*
1Dep. «Roads Design
and Construction», Dnipropetrovsk National University of Railway
Transport named
after Academician V.
Lazaryan, Lazaryan St., 2, Dnipro, Ukraine, 49010, tel./fax
+38 (056) 373 15 48,
e-mail
kunibor@mail.ru, ORCID
0000-0002-8182-7709
2*Dep.
«Track and Track Facilities», Dnipropetrovsk National University of
Railway Transport named
after
Academician V. Lazaryan, Lazaryan St., 2, Dnipro, Ukraine, 49010,
tel. +38 (056) 373 15 42,
e-mail
kurgan@brailsys.com, ORCID 0000-0002-9448-5269
FORECASTING
OF PASSENGER TRAFFIC
UPON
IMPLEMENTATION OF
high-SPEED
RUNNING
Purpose. Forecasting of passenger traffic flows in the future
is an essential and integral part of the complex process of designing
of high-speed network (HSN). HSN direction and its parameters are
determined by the volume of passenger traffic, the estimated value of
which depends on the economic performance of the country, as well as
the material status of citizens living in HSN concentration area,
transport mobility of population, development of competing modes of
transport and so on. The purpose of this work is to analyse the
existing methods of passenger traffic forecasting, to evaluate errors
of the existing models concerning determination of traffic volumes
and to specify the scientific approach to the development of
high-speed rail transport in Ukraine. Methodology. The
existing forecasting methods are reduced to the following ones:
Delphi approach, extrapolation method, factor and correlation
analysis, simulation method. The method described in this paper is
based on scientific approaches such as analysis – a comprehensive
and detailed study of various aspects of the known forecasting
methods, comparing of existing methods for establishing differences
and similarities, as well as deduction – use of general knowledge
to get the new particular one. Thus, the unified indicators
determined for the country as a whole, such as gross domestic
product, national income, total population and others cannot be used
to forecast the traffic flow on specific areas of HSN construction.
Therefore, it is necessary to move from the overall forecast to
traffic volume forecast on particular direction. Findings.
The conclusions are derived from the analysis of different
approaches and methods of passenger flow forecasting. It is proposed
to create typical techniques of traffic flow forecasting using modern
mathematical methods that would allow avoiding unreasonable decisions
and shortening project development time. The resulting
recommendations will help in the efficiency of design decisions, as
well as will determine the quality of the project in whole and the
feasibility of its implementation in particular. Originality.
The scientific approaches to forecasting the passenger traffic
volume in HSN agglomeration area were further developed. The HSN
feasibility study criteria system was updated; this system takes into
account passenger transit flows through Ukraine, the population of
the cities covered by the high-speed network, mobility of population
and other factors. Practical value. The data obtained
by authors can be used to justify the concept of high-speed rail
transport development in Ukraine, to create a high-speed network and
to phase HSN construction.
Keywords: high-speed running;
high-speed network; passenger traffic volume; passenger traffic flow;
forecasting methods; economic efficiency
Introduction
The foreign
studies on the efficiency analysis of high-speed network projects
performed in different countries state that the transport corridor
provided for HSN construction must have certain socio-economic
characteristics. The total population of HSN concentration area must
be at least 20-25 million people, and the overall total passenger
traffic flow (in both directions), formed in this transport corridor
prior to the start of HSN operation, shall be not less than 5.6
million passengers per year [17].
Significant
factors that determine the success of HSN projects are economic
indicators of development of the country and the specific areas of
transport corridors, as well as financial situation of the citizens
who live in HSN concentration area. One of
the economic
criteria that
characterize the
financial
situation of
citizens is
gross domestic
product (GDP).
If the value of GDP is divided by population size, we will get the
index represented in Fig. 1. Yet this average index for a country
does not determine the feasibility of implementing high-speed
transport. For example, in China, it is the lowest – 5.4 million
dollars per person, but the country’s success in HSN construction
is impressive.
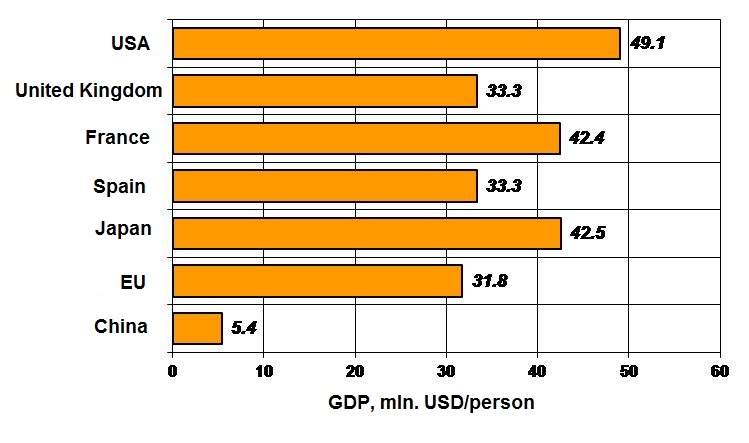
Fig. 1. Gross domestic product, per person
Thus, the
HSN project efficiency must be assessed, first, in light of the
financial situation of the citizens living in HSN concentration
area, secondly, based on GRP indicator, which is calculated by
subtracting from the total gross product (GDP) the volume of its
intermediate consumption and which fully characterizes the economic
activity of the city or region. Using statistics on this indicator
one can predict the potential for economic development, and
accordingly determine the possibility of the construction and
operating conditions of future HSN network sections [9].
In Ukraine GRP is calculated
using the mixed method i.e. part of the data is accumulated by
regional statistical agencies and transferred to the centre and
other part is collected by the State Statistics Committee and other
economy sectors.
The relationship of the
passenger traffic volume with the above mentioned factors allows
predicting the prospective passenger flow and evaluating efficiency
of introduction of high speed traffic in a particular direction.
The
distribution of passenger traffic by mode of transport takes place
on a market basis, depending on the cost of the trip, travel time,
geographical availability of transport infrastructure and other
factors. As a result, zones of efficient use of different transport
means are formed. At the junctions of these areas there is
competition between transport modes (interspecific competition)
[15].
In addition, there is intraspecific competition (competition between
individual companies representing the same mode of transport).
Dependence
published by the International Union of Railways [17]
and clarified with a number of additional data is shown in Fig. 2.
It shows the current distribution of passenger flows between the air
transport and HSN based on travel time by rail.
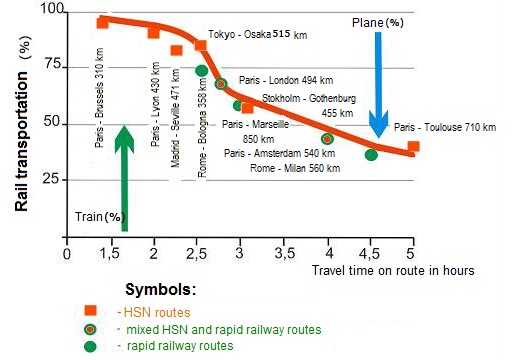
Fig. 2. Distribution of passenger traffic flow
between
high-speed rail and air transport
One of the
important principles of ideology, which is laid in the assessment of
options for the distribution of traffic, is based on forming of
passenger flows and velocity of the passenger, not of the rolling
stock [17].
Today there
are a lot of research works that assess and consider the ways of
further development of the trans-European high-speed rail network.
One of these projects is NGT (Next Generation Train) developed by
eight institutes of the German Air and Space Centre (DLR) [13].
The basic
idea of
NGT is
to determine
the operating
domain of
HSN in
Europe, designed
for a
new generation
of trains
(NGT) with
the speed
of 400 km/h.
The network model covers most of European
countries, including Turkey.
The project NGT investigated
the reference direction Paris-Vienna, the model of which is extended
to the entire European Union, with recommendations for further
adjustments. The basic components and criteria of the model included
economic centres (cities), direct rail connections, train traffic
frequency and travel time. Herewith traffic volumes and density of
population of cities were calculated and regional preferences of
passengers by transport means and others were taken into account.
The resulting transport model allowed forming the recommended
operating domain of the network of new railway lines, proving
feasibility of HSN construction for the speed of 400 km/h in Central
Europe.
Purpose
The question is: will this
European transport model work in other circumstances and in other
countries, such as Ukraine? Obviously, in this case, one must take
into account an individual approach to solving a complex of tasks.
The purpose of this work is to
analyse the existing methods of passenger traffic forecasting, to
evaluate errors of the existing models concerning determination of
traffic volumes and to specify the scientific approach to the
development of high-speed rail transport in Ukraine.
Methodology
HSN
operating domain being the object of study can be presented as a set
of peaks and links between these peaks. In their turn, the peaks are
cities (metropolitan areas) that are key links in the network [3].
Both the peaks and the links
between them have their own indices or evaluation criteria (social,
economic, political, tourism, transport, etc.). For example, social
criteria include population size, life expectancy, health conditions
or pollution of the environment. Socio-economic factors determine
the location of the so-called «strong points», including the
intermediate ones, through which or near which HSN must pass.
Economic
indicators are as follows: level of welfare, income per capita,
gross regional product. Political relations are determined by the
location of urban administrative centres, with their status and
popularity (conducting of cultural events, conferences, sport
competitions), etc. Travel links include business, cultural,
recreational and other trips. Transport links are characterized by
the presence
or absence of certain means of transport by directions (road, rail,
air, etc.), the mobility of the population, passenger traffic flow
(transit and domestic), etc.
Within the large stations and
units, particularly terminals, the high-speed network route should
be connected to the network with other modes of transport: urban,
commuter and air transport. Results of approvals from government and
business entities may require changing the position of the line,
even at the next stages of design.
When
examining the
operating domain for
future HSN
it is appropriate
to consider
the destinations
that already
have rail
lines. Transport
streams at these directions are the most intense [14].
Thus, the presence of the railway is one of the criteria for
determining the areas for potential high-speed trains.
With a view
to selecting of HSN feasibility study criteria assess for a specific
region it is necessary to conduct deep investigation of the above
factors, to develop appropriate methods of decision-making. A step
in this direction is the classification of the main criteria for
determining HSN destinations, specified in [10],
Fig. 3.
The first group of criteria
describes the agglomeration which tends to projected HSN. Stable
growth and tendency of indices to the maximum possible values will
ensure favourable environment for construction and in the future for
operation of HSN.
The
second group of criteria describes the
technical and economic potential of destinations of the prospective
HSN. The line length varies usually from 400 to 900 km for the
purpose of being competitive with air service. [15,
16] The
HSN construction cost depends on the line length and on the
complexity of construction conditions. According to international
estimates the average cost of 1 km of high-speed network is about 25
million Euro [18].
Forecasting
of passenger traffic flows in the future is an essential and
integral part of the complex process of designing of HSN. HSN
direction and its parameters are determined by the volume of
passenger traffic. Therefore, the
methods for
determining the
latter are
subject to
analysis and
refinement.
Also it should be noted that increasing of passenger traffic flow
will enhance the overall economic effect of the introduction of
high-speed traffic.
Many
scientific
papers are dedicated to forecasting
of passenger
flows. Deep
analysis of different models and approaches is presented in [11].
It is appropriate to quote the saying by prof. M. V. Pravdin of this
work: «So far,
the passenger rail transport forecasting has been neglected, as a
result there is no sufficiently strong justification for development
of passenger high-speed transport...». It was written more than
thirty years ago, but has not lost relevance today.
The existing forecasting
methods are reduced to the following ones: Delphi approach,
extrapolation method, factor and correlation analysis and state and
event simulation method.
The first
attempts to use mathematical methods appeared in the late nineteenth
century, when A. Wellington (USA) and E. Lille (Austria-Hungary)
attempted to establish a mathematical relationship between traffic
size, population of corresponding points and distance between them.
Later modifications
of this
model were
proposed, which
were called
«gravity»
[11].
These
models are
based on
the assertion
that there
is transport
«attraction»
between two
large
settlements,
which is
directly
proportional to
the product
of the
population of
these
settlements and
inversely
proportional to
the distance
between them
in degree

 , (1)
, (1)
where
 – flow
from point
– flow
from point
 to point
 ;
; – population
size
respectively at
the points
,
;
– population
size
respectively at
the points
,
; – distance
between two
points;
– distance
between two
points; – proportionality
factor;
– constant
value.
– proportionality
factor;
– constant
value.
Slightly
adjusted
dependence was
proposed by
M.I.
Zahordan and
F.P.
Kravets:
 . (2)
. (2)
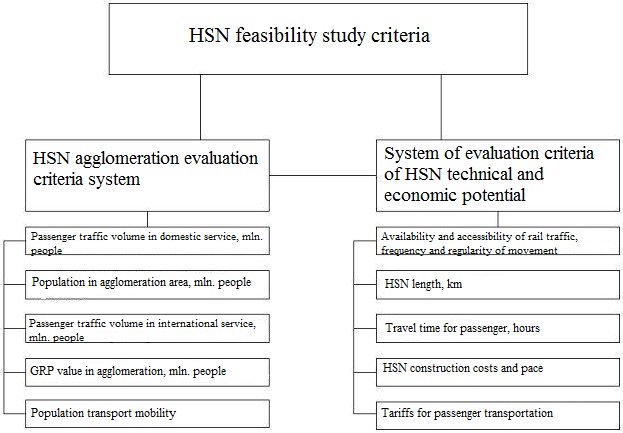
Fig. 3. Classification of the main criteria to determine promising
areas of HSN construction
They believed that the number
of passengers is directly proportional to the product of population
of two settlements and inversely proportional to the square of the
distance between them.
In these
models it is still difficult to determine the proportionality factor
for long-range conditions,
since the factor changes significantly over time. Thus, calculated
on the basis of statistical data on passenger correspondence between
individual points the factor ranged from 0.001 to 0.475. This is due
to the effect of the statistical law of passenger behaviour that can
be formulated as follows: to
overcome the distance
 from the point of view of a passenger it
takes some reasonable time, which is associated with scientific and
technological progress in transportation. Mathematically the law can
be written as
from the point of view of a passenger it
takes some reasonable time, which is associated with scientific and
technological progress in transportation. Mathematically the law can
be written as
 , (3)
, (3)
where
 – speed,
which depends
on the
distance of
travel and
technological
progress
(rolling stock,
infrastructure)
and is
taken into
account through
the time
factor
– speed,
which depends
on the
distance of
travel and
technological
progress
(rolling stock,
infrastructure)
and is
taken into
account through
the time
factor
 ;
;
 – constant
value.
– constant
value.
For example, if the average
time to overcome the distance of 100 km by high speed train TGV POS
climbing 35 ‰ slope is 30 min., then to overcome 1000 km the time
increases not by ten, but 9 times, and on the gradient-free sections
– 8 times.
The
main
disadvantage of
this model
is the
high sensitivity
to errors
while
calculating the
value
and inability
to verify
the reliability
of the
forecasted
model.
A
number of
studies
attempted to
overcome some
of these
disadvantages of
«gravity»
models.
In particular, they examined such factors as gross domestic product,
national income and others. The linear
model was
proposed for forecasting,
the defining
parameters
included national
income, total
population,
urban and
rural
population. As
shown above
(see Fig. 1) the generalized parameters
set for the country as a whole cannot be used to forecast the
traffic flow in specific directions.
It should be
noted that the models developed as «gravity» ones have found wide
application. So, with the participation of experts of SYSTRA Company
(France) in 2002 there were investigated the prerequisites for
implementation of high-speed trains in Ukraine, identified possible
routes for high-speed rail lines based on passenger traffic volume
forecasting [12].
Passenger traffic volume was
calculated according to the formula
 , (4)
, (4)
where
 – model
coefficient.
– model
coefficient.
The
formula (4)
shows that
the passenger
traffic volume
 between two
final
destinations
between two
final
destinations
 and
and
 depends on
the number
of people
living in
final destinations
depends on
the number
of people
living in
final destinations
 ,
frequency of
trips
,
frequency of
trips
 ,
length of
the route
,
length of
the route
 і and duration
of trip
by high-speed
train
і and duration
of trip
by high-speed
train
 between the
cities
and
.
between the
cities
and
.
Analysis of formulae (1) and
(2) shows that they do not take into account transit passenger flow,
which is advisable to transfer partially to high-speed connection.
In addition, the consultant of SYSTRA does not reveal the real
dependence, included in the denominator of the formula (4).
Conditions
for major
transit
passenger flows
are created
due to
vectors of
modern relations
of Ukraine
with the
EU, Belarus,
the Baltic
States, Central
Asia and
the Caucasus
[8].
In this case, a special place is the
study of population transport mobility
index. It is believed to be the
average number of trips per capita per year by all modes of
transport, particularly by rail. In the rail transport segment the
mobility factor is determined by the ratio of number of passengers
transported by rail per year
 to the average annual population of the
region
to the average annual population of the
region ,
served by this rail:
,
served by this rail:
 .
(5)
.
(5)
Findings
The authors
analysed the dynamics, trends of passenger traffic and calculated
the mobility indices by the formula (5) (Table 1). The forecasted
population in 2020 is adopted according to JSC «Ukrzaliznytsia»
[1]
and the number of outgoing passengers – according to [5].
As
the table
1 shows, the
calculated long-distance traffic index
 differs
significantly by
rail (regions)
and ranges
from 0.9 to
2.28; it is
in average
1.5 trips per
year.
differs
significantly by
rail (regions)
and ranges
from 0.9 to
2.28; it is
in average
1.5 trips per
year.
Unlike the
formula (4), used by SYSTRA, the work [2]
presents the formula to calculate the forecasted passenger traffic
volume, which takes into account passenger transit flows through
Ukraine and the population in the cities covered by the high-speed
network:
 . (6)
. (6)
where
– forecasted annual number of passengers
between two cities
and
,.
ths people;
 – population
of the cities
and
accordingly,
ths people;
– population
of the cities
and
accordingly,
ths people;
 ,
,
 – transit passenger flow through station
A and
reverse movement from station
,
ths people;
– transit passenger flow through station
A and
reverse movement from station
,
ths people;
 – total number of people at all stations
of high-speed network, ths people;
– total number of people at all stations
of high-speed network, ths people;
 – transit passenger flow through all
stations of high-speed network, ths people;
–population mobility in Ukraine on HSN,
share;
– transit passenger flow through all
stations of high-speed network, ths people;
–population mobility in Ukraine on HSN,
share;
 – coefficient taking into account travel
time of passengers on a given section according to the average
length of the trip – 4 hours, which varies from 0.75 to 1.25,
share;
– coefficient taking into account travel
time of passengers on a given section according to the average
length of the trip – 4 hours, which varies from 0.75 to 1.25,
share;
 – coefficient additionally taking into
account frequency of passenger’s travel on a given section
(business trip, change to the airplane, vacation, tourism), which
varies from 0.75 to 0.9 for the regional cities with population of
up to 600 thousand and the cities of Kriviy Rig, Melitopol and
Mariupol, 0.9 – 1.1 for the regional cities with population of up
to 600-1000 thousand and the cities of Lviv and Kharkiv,
1.3 – 1.5 for the cities of Kyiv,
Simferopol and Odessa.
– coefficient additionally taking into
account frequency of passenger’s travel on a given section
(business trip, change to the airplane, vacation, tourism), which
varies from 0.75 to 0.9 for the regional cities with population of
up to 600 thousand and the cities of Kriviy Rig, Melitopol and
Mariupol, 0.9 – 1.1 for the regional cities with population of up
to 600-1000 thousand and the cities of Lviv and Kharkiv,
1.3 – 1.5 for the cities of Kyiv,
Simferopol and Odessa.
The
coefficient
takes into
account the
travel time
of passengers
between specific
cities and
significantly
affects the
demand for
HSN. For
example, travel time from Lviv to Simferopol will be about 6 hours.
At the same time, travel time between Kyiv and Dnipropetrovsk will
be reduced to two hours. Because of this difference in time the
demand for the use of high-speed network can vary by almost in half.
These data are recorded in France and other European countries.
Experience in operating speed trains in Ukraine in 2013 showed that
demand for passenger transportation between Kharkiv and Kyiv 1.5
times higher than that between Donetsk and Kyiv as the difference in
travel time is 1.5 hours.
Table
1
Population mobility
in long distance rail traffic
|
Railways
|
Number of
residents
in the
territory,
ths people
|
Passengers transported,
ths people
|
Mobility factor
|
|
|
|
total
|
long distance traffic
|
overall
|
long distance traffic
|
|
Ukraine
|
42 400
|
448 436
|
62 519
|
10.58
|
1.47
|
|
Lviv
|
8 493
|
65 223
|
9 133
|
7.68
|
1.08
|
|
Pivdenno-Zakhidna
(Southwestern)
|
8 882
|
139 116
|
20 263
|
15.66
|
2.28
|
|
Pivdenna
(Southern)
|
4 769
|
69 430
|
8 091
|
14.56
|
1.70
|
|
Pryniprovska (Near-Dnipro)
|
7 125
|
77 836
|
11 311
|
10.92
|
1.59
|
|
Odessa
|
6 894
|
34 580
|
8 021
|
5.02
|
1.16
|
|
Donetsk
|
6 329
|
62 252
|
5 699
|
9.84
|
0.90
|
However,
the factor
that determines the population mobility
needs clarifying because mobility in different regions is different.
In addition,
the formula (6) is not without drawbacks. Let us consider a specific
example. Fig. 4 shows two variants for high-speed lines between Kyiv
and Lviv. The population that lives in urban areas (thousand people)
is shown in the diagram. Transit is adopted the same for both
variants – 50 thousand people per year. The results by the formula
(6), i.e. the projected number of passengers, are as follows: in
case of the northern variant – 1 million people a year, the
southern variant – 850 thousand people a year,
that is not logical as the overall
population at all the stations of high-speed network in southern
variant is bigger and the passenger traffic flow is smaller. So the
formula (6) does not include cases where the transit passenger flow
has a significant share.
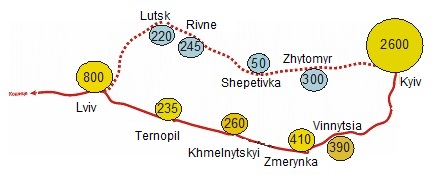
Fig. 4. Variants for high-speed
network
with population of
cities
Currently, the most developed
are extrapolation methods, involving transfer of the trends observed
in the past into the future. This approach is possible due to the
inertia properties of different processes.
Transport mobility of the
population can be characterized either by number of trips per capita
per year (mobility factor) or by the average number of
passenger-kilometres per inhabitant per year – use of passenger
transport services by one resident.
Volume of passenger traffic is
calculated using the mobility index that takes into account the
frequency of trips per year per inhabitant of the related area.
Getting of
qualitatively new effect in the forecasting practice is associated
with the use of factor and correlation analysis. So, to check the
relation of population incomes with mobility index the work [9]
presents the correlation analysis, the results of which revealed
that there is quite close dependence of the mobility index on the
value of disposable real incomes of the population.
The
authors also
believe that
the most
generalized and
complete
definition of
transport
mobility should
be considered
not the
number of
trips regardless
the travel
distance, but
passenger-kilometres
per capita,
i.e.
 , (7)
, (7)
where
 – passenger
traffic flow of railways, mln pass.-km.
– passenger
traffic flow of railways, mln pass.-km.
To compare
trends in transport mobility and incomes, Fig. 5 and 6 show the
results obtained in [7],
and Table 2 and Fig. 7 – calculations performed before the year
2015. Column 5 shows the population mobility indices, calculated by
the formula (7).
One of the most accurate ways
to assess the economic development of the state is considered gross
domestic product (GDP), and for population the real income is that
cited in statistics as nominal one (reproduced at current prices of
this year – c. 6) and real one (adjusted for inflation – c.
7).
The
performed
correlation and
regression
analysis showed
that the
correlation
coefficient
between them
is
rmob=0.882.
The linear
regression
equation, which
allows
calculating the
average standard
value of
mobility ( )
on the
value of
disposable real
income per
capita (
)
on the
value of
disposable real
income per
capita ( ),
is as
follows:
),
is as
follows:
 , (8)
, (8)
where
the regression
coefficient
0.00876 represents
more or
less uniform
chain growth
of mobility
in arithmetic
progression.
This means that the change in disposable
real income per capita by 1 UAH increases rail transport mobility by
8.76 pass.-km per person. The authors of the work [9]
believe that the revealed tendencies (Equation 8) can allow
forecasting the disposable real incomes and mobility per person.
Their forecast for 2015 is as follows: mobility per capita – 1242
pass.-km, disposable real income per capita – 20.9 thousand UAH.
Comparison with factual data for 2015 showed that neither the first
nor the second index was not confirmed: mobility per capita made 835
pass.-km, and the real income – about 24 thousand UAH/person.
Table 2
Calculation of
transport (by
railways)
mobility of
the population
|
Years
|
Passenger
traffic flow
of railways, mln pass.-km
|
Total
income f population,
mln UAH
|
Population
size in Ukraine, people
|
Population
mobility,
pas.- km / per person
|
Nominal
income UAH/ per person
|
Real
incomes, UAH/ per person
|
|
2000
|
51 800
|
128 736
|
49 430
|
1 048
|
2 631
|
2 180
|
|
2001
|
52 700
|
157 996
|
48 923
|
1 088
|
3 261
|
2 490
|
|
2002
|
50 400
|
185 073
|
48 457
|
1 040
|
3 855
|
2 938
|
|
2003
|
52 200
|
215 672
|
48 004
|
1 087
|
4 529
|
3 400
|
|
2004
|
51 800
|
274 241
|
47 622
|
1 088
|
5 800
|
4 468
|
|
2005
|
52 400
|
381 404
|
47 281
|
1 108
|
8 127
|
6 332
|
|
2006
|
53 400
|
472 061
|
46 930
|
1 135
|
10 120
|
7 771
|
|
2007
|
53 400
|
623 289
|
46 646
|
1 145
|
13 362
|
10 126
|
|
2008
|
53 225
|
845 641
|
46 373
|
1 148
|
18 326
|
13 716
|
|
2009
|
48 327
|
894 286
|
46 053
|
1 049
|
19 454
|
14 091
|
|
2010
|
50 240
|
1 101 175
|
45 870
|
1 095
|
24 006
|
17 285
|
|
2011
|
50 569
|
1 266 753
|
45 693
|
1 107
|
27 723
|
19 683
|
|
2012
|
49 203
|
1 457 864
|
45 577
|
1 080
|
31 987
|
22 711
|
|
2013
|
48 876
|
1 548 733
|
45 483
|
1 075
|
34 051
|
23 836
|
|
2014
|
37 065
|
1 516 768
|
43 722
|
848
|
34 691
|
24 284
|
|
2015
|
35 913
|
1 520 000
|
43 000
|
835
|
35 349
|
24 037
|
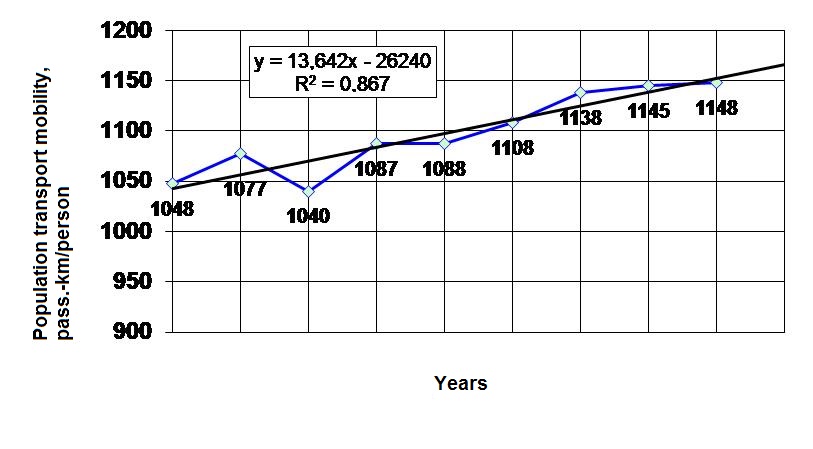
Fig. 5. Transport mobility of the population
between 2000 and
2008
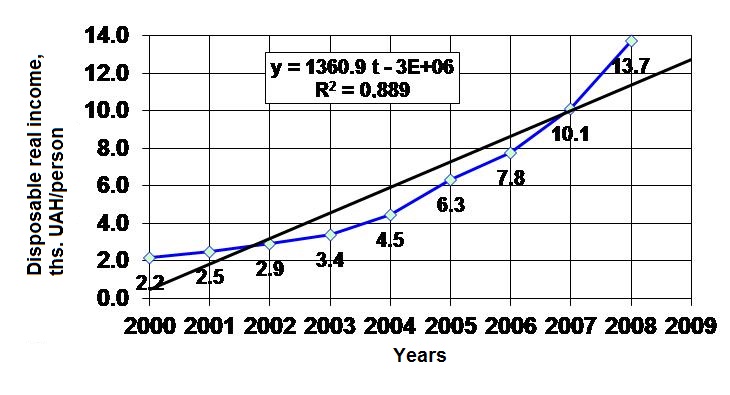
Fig. 6. Real income of the population
between 2000 and 2008
This can be explained by the
following (see Fig. 5 and 7): transport mobility of the population
had been increasing by the year 2008, but has decreased in the
following years. At the same time, the dynamic of growth of
disposable income of the population was positive.
In Ukraine,
the first step to improve the quality of transport services was the
introduction of rapid trains (Intersiti+ trains): since May 15, 2012
on the section Kyiv – Kharkiv, Kyiv – Lviv, Kyiv – Donetsk;
since November 11, 2012 the high-speed
train was introduced on the section Kyiv
– Dnipropetrovsk, and since May 2013 this route was extended to
Zaporizhzhia; in
2014 the following high-speed directions were opened: Kyiv –
Odesa, Kyiv – Ternopil, Darnytsia – Truskavets.
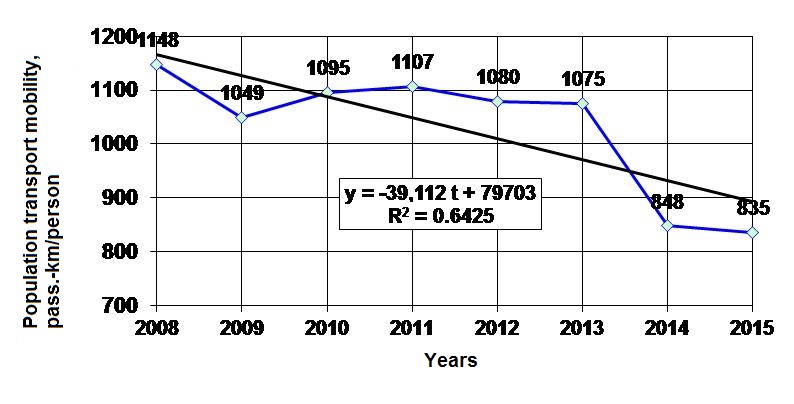
Fig. 7. Transport mobility of the population
between 2008 and
2015
The main purpose of new HSN is
to provide large volumes of passenger traffic between two or more
regional cities and their agglomeration areas with minimal time loss
by passengers. The involvement of large settlements to the chosen
direction of HSN is determined by the amount of passenger traffic
and revenues from the operation.
Future
HSN
concentration
areas in
Ukraine [12],
including the
following cities
and economic
and tourist
centres:
– Kyiv
(capital of
Ukraine) and
the Kyiv
region, Kyiv
has about
2.9 million
inhabitants;
– Regions
of Kharkiv
and Poltava,
Ukrainian cities
with about
2.0 million
inhabitants;
– Dnipropetrovsk
(now Dnipro), Dniprodzerzhinsk
(now Kamianske), Zaporizhzhia
and Kryvyi
Rih – about
3 million
inhabitants;
– Donbas,
economic
activity in
large cities
such as
Donetsk (about
1 million
inhabitants),
Luhansk (500
thousand
inhabitants), Mariupol
(about 500
thousand
inhabitants),
etc.
Tourist regions – Odesa (over
1 million people) Mykolaiv (500 thousand people), Kherson (300
thousand people), Sevastopol and Simferopol (about 700 thousand
people).
West Region. Lviv has 730
thousand residents, while in the region – more than 2.5 million
inhabitants.
Zakarpattia region is located
on the edge of Western Ukraine immediately adjacent to 4 countries:
Poland, Slovakia, Hungary and Romania. Zakarpattia, as of 2015 there
are more than 250 resorts of different concepts and sightseeing
sites of tourism and recreation.
Ukraine is
among the countries with high population density (79 people per 1
km2).
This is a fairly high rate, indicating a generally favourable living
conditions and high level of territory development. For comparison,
the population density in Russia per 1 km2
is 8.4 persons, in Republic of Belarus – 47.9 persons, in
Kazakhstan – 5.4 persons.
When
performing the
forecasting
calculations by
directions of
international
transport
corridors one
can use
the model
of forecasting
passenger
traffic needs
tried and
tested within
the framework
of TACIS
involving the
companies EPV
EuroprojrktVerkehr
(Germany) SGTE
(England),
HyprotransTЭY
(Russia),
Transmark
(England),
Transpolis
(Ukraine) [5].
This forecasting model, given
the high uncertainty of the general economics and sociological
position of the concentration area, uses statistic data and opinion
of the experts, namely of the International Centre for Policy
Studies (Soros Foundation).
Based
on forecast
data, it
is estimated
that in
Ukraine in
2035 – 2040 about
130 million
passengers will
use the
high-speed
network annually.
These traffic
volumes
correspond to
an annual
turnover of
54 billion
pass.-km.
One of the possible schemes of HSN
development in Ukraine is shown in Fig. 8.
Fig. 8. The recommended variant of HSN
Originality and practical
value
This work further developed the
scientific approaches to forecasting the passenger traffic volume in
HSN agglomeration area. The HSN feasibility study criteria system
was updated; this system takes into account passenger transit flows
through Ukraine, the population of the cities covered by the
high-speed network, mobility of population and other factors.
The obtained data can be used
to justify the concept of high-speed rail transport development in
Ukraine, to create a high-speed network and to phase HSN
construction.
Conclusions
Based
on the
analysis of
the studies
we can make the
following
conclusions:
1. To
determine the rational routes of high-speed rail lines based on
forecasted passenger traffic volume the widespread use is gained by
«gravity» mathematical models based on the assumption that the
strength of the interaction of cities and regions adjacent to the
forecasted HSN is proportional to the product of qualitative and
quantitative indices of the regions and inversely proportional to
the distance between the cities. These mathematical models are
widely used in regional analysis, during the study of expert and
import relationships between regions, but should be adjusted on the
basis of economic development, regional business activity,
population mobility factor, the value of which may vary considerably
depending on the growth of income, speed, comfort and service
provided by high-speed transport.
2. Economic
integration in the European Union can increase the flow of
passengers in the international traffic, and the implementation of
the European high-speed network expansion program in Eastern Europe
and CIS will allow the railways of Ukraine to become integrated in
the high-speed network of Europe. The Ukrainian routes of high-speed
rail lines proposed by SYSTRA (France) in 2002 based on forecasted
passenger traffic volume do not take into account the transit flow
through Ukraine and the passenger mobility factor. Thus, the
proposed network topology and HSN construction phasing require
correction.
3. From
the analysis
of different
approaches and
techniques it
follows that
passenger flow
forecasting
requires
development and
use of
advanced
mathematical
techniques,
creation of
common methods
of traffic
flow
forecasting,
which will
allow to
prevent
unreasonable
decisions and
shorten project
development
period.
4. The
studies show that to attract passengers on the distance of up to
600-800 km the lowest limit is the maximum speed of 250 km/h, at
which travel time will not exceed 4 hours. Based on the fact that
the average ratio between the route and the maximum speed is
0.7-0.85, it is necessary to ensure the maximum speed at the
level of 300-350 km/h.
LIST OF REFERENCE LINKS
Аналітична
записка до Концепції Державної цільової
програми розвитку пасажирських
перевезень на залізничному транспорті
України до 2020 року.
–
Київ :
Київдіпротранс, 2010. – 39 с.
Бараш,
Ю. С. Економічна ефективність
високошвидкісних пасажирських
залізничних перевезень в Україні :
монографія / Ю. С. Бараш, А. В. Момот. –
Дніпропетровськ : Вид-во Дніпропетр.
нац. ун-ту залізн. трансп. ім. акад. В.
Лазаряна, 2015. – 137 с.
Босов,
А. А. Формирование вариантов рациональной
сети линий высокоскоростного движения
поездов в Украине : монография / А. А.
Босов, Г. Н. Кирпа. – Днепропетровск :
Изд-во
Днепропетр.
нац. ун-та
ж.-д.
трансп.,
2004. – 144 с.
Довідник
основних показників роботи залізниць
України (2005–2015 роки) : ПАТ «Українська
залізниця».
– Київ, 2016. – 58
с.
Кірпа,
Г. М. Інтеграція залізничного транспорту
України у європейську транспортну
систему : монографія / Г. М. Кірпа. – 2-е
вид., перероб. і доп. – Дніпропетровськ
: Вид-во Дніпропетр. нац. ун-ту залізн.
трансп. ім. акад. В. Лазаряна, 2004. – 248
с.
Курган,
М. Б. Швидкість за міжнародними
стандартами / М. Б. Курган // Українські
залізниці. – 2015. – № 11-12. – С. 36–39.
Курган,
Н. Б. Предпосылки создания высокоскоростных
магистралей в Украине / Н.
Б. Курган
// Українські залізниці. – 2015. – №
5-6 (23-24). –
С. 16–21.
Макаренко,
М. В. Аналіз динаміки і структури
перевезень пасажирів залізничним
транспортом / М. В. Макаренко, І. М.
Гойхман / Зб. наук. пр. Держ. економ.-технол.
ун-ту трансп. Серія: «Економіка і
управління». – Киів, 2010. – Вип.
16. – С.
165–184.
Миненко,
Д. О. Критерии определения направлений,
перспективных для организации
высокоскоростного железнодорожного
движения / Д. О. Миненко ; под ред. В. С.
Шварцфельда // Проектирование развития
региональной сети железных дорог : сб.
науч. тр. / Дальневост.
гос.ун-т
путей сообщения.
– Хабаровск, 2014. – Вып. 2. – С. 63–70.
Правдин,
Н. В. Прогнозирование пассажиропотоков
(методика, расчеты,
примеры)
/ Н. В. Правдин, В.
Я. Негрей.
– Москва
: Транспорт, 1980. – 224
с.
Предварительное
технико-экономическое обоснование
проекта высокоскоростной железнодорожной
сети в Украине. Окончательный отчет.
–
Киев
: SYSTRA, 2002.
–
311 с.
Проект
NGT – новый потенциал высокоскоростного
движения в Европе // Железные дороги
мира. – 2013. – № 3. – С. 14–23.
Fischer,
S. Traction Energy Consumption of Electric Locomotives and Electric
Multiple Units at Speed Restrictions
/ S. Fischer //
Acta Technica
Jaurinensis. – 2015. – Vol.
8,
No.
3. – P.
240–256.
doi: 10.14513/actatechjaur.v8.n3.384.
Integrated
airline scheduling: considering competition effects and the entry
of the high speed rail /
L. Cadarso,
V.
Vaze,
C. Barnhart, Á.
Marín //
Transportation
Science. – 2016. – Vol.
18. – P. 212–219. doi:
10.1287/trsc.2015.0617.
Moyano,
A. High Speed Rail Commuting: Efficiency Analysis of the Spanish
HSR Links /
A. Moyano
//
Transportation
Research Procedia. –
2016. – Vol.
18. – P.
212–219.
doi:10.1016/j.trpro.2016.12.029.
New
routes on old railways: increasing rail’s mode share within the
constraints of the existing railway network /
S.
P.
Blainey,
J.
Armstrong, A.
S. J. Smith, J. M.
Preston //
Transportation.
– 2016. – Vol. 43.
–
Iss. 3. – P.
425–442.
doi: 10.1007/s11116-015-9582-5.
17. High speed rail. First
track to sustainable mobility.
[Electronic
resource]
–
Paris : UIC, 2009. –
14 р.
–
Available at: http://www.vialibre-ffe.com/PDF/4509_AVE_UIC.pdf. –
Title from the screen. – Accessed : 15.02.2017.
М. Б. Курган1,
Д. М. курган2*
1Каф.
«Проектування і будівництво доріг»,
Дніпропетровський національний
університет залізничного транспорту
імені академіка В. Лазаряна, вул.
Лазаряна, 2, Дніпро, Україна, 49010, тел./факс
+38 (056) 373 15 48,
ел. пошта kunibor@mail.ru, ORCID
0000-0002-8182-7709
2*Каф.
«Колія та колійне господарство»,
Дніпропетровський національний
університет залізничного транспорту
імені академіка В. Лазаряна, вул.
Лазаряна, 2, Дніпро, Україна, 49010,
тел. +38 (056) 373 15 42,
ел. пошта
kurhan.d@gmail.com,
ORCID
0000-0002-9448-5269
ПРОГНОЗУВАННЯ ПАСАЖИРСЬКИХ
ПЕРЕВЕЗЕНЬ
ПРИ ВПРОВАДЖЕННІ
ВИСОКОШВИДКІСНОГО
РУХУ ПОЇЗДІВ
Мета.
Прогнозування пасажирських
транспортних потоків на перспективу
є найважливішою й невід'ємною частиною
складного процесу проектування
високошвидкісних магістралей (ВШМ).
Напрямок ВШМ та її параметри визначаються
обсягами пасажирських перевезень,
прогнозована величина яких залежить
від економічних показників розвитку
країни, а також від матеріального
становища громадян, які проживають у
зоні тяжіння ВШМ, транспортної рухливості
населення, розвитку конкуруючих видів
транспорту тощо. Метою даної роботи є
аналіз існуючих методів прогнозування
пасажирських перевезень, оцінка похибок
існуючих моделей щодо визначення
обсягів перевезень та уточнення наукових
підходів до обґрунтування доцільності
розвитку в Україні високошвидкісного
залізничного транспорту. Методика.
Існуючі методи прогнозування зводяться
до таких: методи експертних оцінок,
методи екстраполяції, факторного і
кореляційного аналізу, методи моделювання.
Методика, викладена в даній роботі,
базується на таких наукових підходах,
як: аналіз – всебічне і детальне вивчення
різних аспектів відомих методів
прогнозування; порівняння існуючих
методів для встановлення відмінності
та подібності; а також на дедукції –
використанні загальних знань для
отримання нових приватних. Так,
узагальнені показники, встановлені
для країни в цілому, такі як валовий
внутрішній продукт, національний дохід,
загальна чисельність населення та ін.
не можуть бути використані для
прогнозування пасажиропотоку на
конкретних напрямках будівництва ВШМ.
Отже, від загального прогнозу необхідно
переходити до прогнозування обсягів
перевезень на конкретному напрямку.
Результати. Зроблені висновки
випливають із аналізу різних підходів
та методик прогнозування пасажиропотоків.
Запропоновано створювати типові
методики прогнозування транспортних
потоків на основі сучасних математичних
методів, що дасть можливість попередити
необґрунтовані рішення й скоротити
терміни розробки проектів. Отримані в
роботі рекомендації сприятимуть
ефективності проектних рішень,
визначатимуть якість проекту в цілому
та доцільність його реалізації зокрема.
Наукова новизна. Набули подальшого
розвитку наукові підходи до прогнозування
обсягів пасажирських перевезень у зоні
агломерації, що тяжіє до ВШМ. Доповнена
система критеріїв оцінки доцільності
спорудження ВШМ, яка враховує транзитні
потоки пасажирів через територію
України, чисельність населення в містах,
охоплених високошвидкісною мережею,
мобільність населення та ін. фактори.
Практична значимість. Отримані
авторами дані можуть бути використані
для обґрунтування концепції розвитку
високошвидкісного залізничного
транспорту в Україні, формування мережі
високошвидкісних магістралей та
встановлення етапів будівництва ВШМ.
Ключові
слова: високошвидкісний рух поїздів;
високошвидкісні магістралі; обсяг
пасажирських перевезень; пасажирообіг;
методи прогнозування; економічна
ефективність
Н. Б. Курган1, Д. Н. курган2*
1Каф.
«Проектирование и строительство дорог»,
Днепропетровский национальный
университет железнодорожного транспорта
имени академика В. Лазаряна, ул. Лазаряна,
2, Днипро, Украина, 49010, тел./факс +38 (056)
373 15 48,
эл. почта kunibor@mail.ru,
ORCID
0000-0002-8182-7709
2*Каф.
«Путь и путевое хозяйство», Днепропетровский
национальный университет железнодорожного
транспорта
имени академика В. Лазаряна,
ул. Лазаряна, 2, Днипро,
Украина, 49010, тел. +38 (056) 373 15 42,
эл. почта
kurgan@brailsys.com,
ORCID
0000-0002-9448-5269
ПРОГНОЗирование ПАССАЖИРСКИХ
ПЕРЕВозок
ПРИ Внедрении ВЫСОКОСКОРОСТНОГО
движения поездов
Цель.
Прогнозирование
пассажирских транспортных потоков на
перспективу есть важнейшей и неотъемлемой
частью складывающегося процесса
проектирования высокоскоростных
магистралей (ВСМ). Направление ВСМ и ее
параметры определяются объемами
пассажирских перевозок, прогнозируемая
величина которых зависит от экономических
показателей развития страны, а также
от материального положения граждан,
которые проживают в зоне тяготения
ВСМ, транспортной подвижности населения,
развития конкурирующих видов транспорта
и т.п. Целью данной работы является
анализ существующих методов прогнозирования
пассажирских перевозок, оценка
погрешностей существующих моделей
относительно определения объемов
перевозок и уточнение научных подходов
к обоснованию целесообразности развития
в Украине высокоскоростного
железнодорожного транспорта. Методика.
Существующие
методы прогнозирования сводятся к
таким: методы экспертных оценок, методы
экстраполяции, факторного и корреляционного
анализа, методы моделирования. Методика,
изложенная в данной работе, базируется
на таких научных подходах, как: анализ
– всестороннее и детальное изучение
разных аспектов известных методов
прогнозирования; сравнение существующих
методов для установления отличия и
сходства; а также на дедукции –
использовании общих знаний для получения
новых частных. Так, обобщенные показатели,
установленные для страны в целом, такие
как валовой внутренний продукт,
национальный доход, общая численность
населения и др. не могут быть использованы
для прогнозирования пассажиропотока
на конкретных направлениях строительства
ВШМ. Таким образом, от общего прогноза
необходимо переходить к прогнозированию
объемов перевозок на конкретном
направлении. Результаты.
Сделанные
выводы вытекают из анализа разных
подходов и методик прогнозирования
пассажиропотоков. Предложено создавать
типовую методику прогнозирования
транспортных потоков на основе
современных математических методов,
которая даст возможность предупредить
необоснованные решения и сократить
сроки разработки проектов. Полученные
в работе рекомендации будут оказывать
содействие эффективности проектных
решений, определять качество проекта
в целом и целесообразность его реализации
в частности. Научная
новизна. Приобрели
дальнейшее развитие научные подходы
к прогнозированию объемов пассажирских
перевозок в зоне агломерации, которая
тяготеет к ВСМ. Дополнена система
критериев оценки целесообразности
сооружения ВСМ, которая учитывает
транзитные потоки пассажиров через
территорию Украины, численность
населения в городах, охваченных
высокоскоростной сетью, мобильность
населения и др. факторы. Практическая
значимость. Полученные
данные могут быть использованы для
обоснования концепции развития
высокоскоростного железнодорожного
транспорта в Украине, формирования
сети высокоскоростных магистралей и
установления этапов строительства
ВСМ.
Ключевые
слова: высокоскоростное движение
поездов; высокоскоростные магистрали;
объем пассажирских перевозок;
пассажирооборот; методы прогнозирования;
экономическая эффективность
REFERENCES
Analitychna zapyska do Kontseptsii Derzhavnoi tsilovoi prohramy
rozvytku pasazhyrskykh perevezen na zaliznychnomu transporti
Ukrainy do 2020 roku. (2010). Kyiv: Kyivdiprotrans.
Barash,
Y. S., & Momot,
A. V. (2015). Ekonomichna efektyvnist vysokoshvydkisnykh
pasazhyrskykh zaliznychnykh perevezen v Ukraini.
Dnipropetrovsk: Dnipropetrovsk National University of Railway
Transport named after Academician V. Lazaryan
Press.
Bosov,
A. A., & Kirpa,
G. N. (2004).
Formirovaniye variantov
ratsionalnoy seti liniy vysokoskorostnogo dvizheniya poyezdov
v Ukraine. Dnepropetrovsk: Dnipropetrovsk National University
of Railway Transport named after Academician V.
Lazaryan Press.
PJSC
Ukrzaliznytsia (2016). Dovidnyk
osnovnykh pokaznykiv
roboty zaliznyts
Ukrainy (2005-2015 roky).
Kyiv.
Kirpa,
H. M. (2004). Intehratsiia zaliznychnoho transportu Ukrainy u
yevropeisku transportnu systemu. Dnipropetrovsk: Dnipropetrovsk
National University of Railway Transport named after Academician V.
Lazaryan Press.
Kurhan,
M. B. (2015).
Shvydkist za mizhnarodnymy standartamy.
Ukrainski zaliznytsi,
11-12,
36-39.
Kurhan,
M. B. (2015).
Predposylki sozdaniya vysokoskorostnykh magistraley v
Ukraine. Ukrainski zaliznytsi,
5-6(23-24), 16-21.
Makarenko,
M. V., & Hoikhman, I. M. (2010).
Analiz dynamiky i struktury perevezen pasazhyriv zaliznychnym
transportom. Proceedings of the State Economic and Technological
University of Transport series «Economics
and Management», 16,
165-184.
Minenko,
D. O. (2014). Kriterii opredeleniya napravleniy, perspektivnykh
dlya organizatsii vysokoskorostnogo zheleznodorozhnogo dvizheniya.
In V.
S. Shvartsfeld (Ed.),
Proyektirovaniye
razvitiya regionalnoy seti zheleznykh dorog (2,
pp.
63-70). Khabarovsk: Izdatelstvo
DVGUPS.
Pravdin,
N. V., & Negrey, V. Y. (1980). Prognozirovaniye
passazhiropotokov (metodika, raschety, primery). Moscow:
Transport.
Predvaritelnoye
tekhniko-ekonomicheskoye
obosnovaniye proyekta
vysokoskorostnoy zheleznodorozhnoy seti v Ukraine. (2002).
Kyiv: SYSTRA.
Schumann,
T., & Lemmer,
K. (2013). Project NGT
– new potential for high-speed rail in Evrope. Zheleznyye
dorogi mira, 3, 14–23.
Fischer,
S. (2015). Traction
Energy Consumption of Electric Locomotives and Electric Multiple
Units at Speed Restrictions. Acta
Technica Jaurinensis, 8(3),
240-256. doi:
10.14513/actatechjaur.v8.n3.384
Cadarso,
L., Vaze, V., Barnhart,
C., & Marín, Á. (2016).
Integrated airline scheduling: considering competition effects and
the entry of the high speed rail. Transportation Science.
doi: 10.1287/trsc.2015.0617
Moyano,
A. (2016). High Speed Rail Commuting: Efficiency Analysis of the
Spanish HSR Links. Transportation Research Procedia, 18,
212-219. doi: 10.1016/j.trpro.2016.12.029
Blainey,
S. P., Armstrong, J., Smith, A. S. J., & Preston, J. M. (2016).
New routes on old railways: increasing rail’s mode share within
the constraints of the existing railway network. Transportation,
43(3), 425-442.
doi: 10.1007/s11116-015-9582-5
High
speed rail. First track to sustainable mobility.
(2010). Paris: UIC.
Prof. V. D. Petrenko, D. Sc.
(Tech.), (Ukraine); Prof. E. I. Danilenko, D. Sc. (Tech.), (Ukraine)
recommended this article to be published
Accessed:
Oct. 28, 2016
Received:
Jan. 09,
2017
doi
© M. B. Kurhan, D. M. Kurhan, 2017