ISSN
2307–3489 (Print), ІSSN
2307–6666
(Online)
Наука
та прогрес транспорту. Вісник
Дніпропетровського
національного університету залізничного
транспорту, 2020,
№ 2
(86)
ІНФОРМАЦІЙНО-КОМУНІКАЦІЙНІ
ТЕХНОЛОГІЇ ТА МАТЕМАТИЧНЕ МОДЕЛЮВАННЯ
ІНФОРМАЦІЙНО-КОМУНІКАЦІЙНІ
ТЕХНОЛОГІЇ
ТА МАТЕМАТИЧНЕ МОДЕЛЮВАННЯ
UDC
004.7:[519.876.5:656.212.5]
V. M. PAKHOMOVA1*,
D. I. NAZAROVA2*
1*Dep.
«Electronic Computing Machines», Dnipro National University of
Railway Transport named after Academician
V. Lazaryan, Lazaryana
St., 2, Dnipro, Ukraine, 49010, tel. +38 (056) 373 15 89, e-mail
viknikpakh@gmail.com,
ORCID 0000-0002-0022-099X
2*Dep.
«Electronic Computing Machines», Dnipro National University of
Railway Transport named after Academician
V. Lazaryan, Lazaryana
St., 2, Dnipro, Ukraine, 49010, tel. +38 (056) 373 15 89, e-mail
olkdi@outlook.com,
ORCID 0000-0002-7134-9416
ORGANIZING WIRELESS
NETWORK AT
MARSHALLING
YARDS USING THE BEE
METHOD
Purpose. In general, today wireless networks are widely used
as an alternative to wired, allowing you to connect multiple devices,
both among themselves in the local and global Internet. However, at
the present stage in Ukraine there is no widespread use of a wireless
network at rail transport, therefore it is advisable to conduct
research on the deployment of such a network, in particular, at a
marshalling yard. Methodology. Using LocBS‑BeeCol
program model written in Python according
to the bee colony algorithm the optimal number of base stations (BS)
of the wireless network and their location at the marshalling yards
was determined, as well as research on the bee algorithm parameters
was conducted. Input data of the LocBS‑BeeCol
model are as follows: marshalling yard parameters (area, number of
clients that need to be connected to base stations); wireless network
parameters (base station coverage radius, maximum number of clients
for one base station); parameters of the bee colony algorithm (number
of scout bees, number of attempts to find the optimal solution using
one bee). Findings. For marshalling yards of various
capacities (small, medium and high), the optimal number of base
stations of the wireless network was obtained with restrictions on
the coverage radius of the base station and the number of clients
connected to it. Thus, for example, to connect 300 clients at
medium-sized marshalling yards with an area of 2500x500 m2,
93 base stations with a coverage radius of 50 m are needed.
Originality. The quality of the obtained solutions
significantly depends on the choice of the bee colony algorithm
parameters. A study of the base stations number of the wireless
network and search time for finding the optimal solution for
different number of bees and the number of attempts to find the
optimal solution using the bee for marshalling yards of various
capacities was carried out. It was determined that an increase in the
number of bees (from 10 to 50) and the number of attempts to find the
optimal solution by a bee (from 10 to 50) improves the quality of the
optimal solution (decrease
in the number of base stations by an average of 6.5% and
9.3%), respectively. In addition, increase in the bee number (from 10
to 50) reduces the search time for the optimal solution by bees by an
average of 1.8 times, while increase in the number of attempts to
find the optimal solution by a bee (from 10 to 50) will increase
search time for the optimal solution on average 2.14 times.
Practical value. An algorithm and its software
implementation have been developed, which make it possible to
determine the required number of base stations and their location
when deploying a wireless network at a marshalling yards. For
marshalling yards with high capacity, when the coverage radius of the
base station is doubled (from 50 to 100 m), their number decreases by
about half (from 136 to
64), while the time for finding the optimal solution by bees
increases by 2.5 times (from
8.4 to 20.6
s).
Keywords: marshalling yard; wireless network; base station
(BS); coverage radius; bee method; bees; attempts; search time
Introduction
A wireless network is a
connection of computers and other devices for information exchange
without the use of wires; the connection is made through radio
channels. The installation of a wireless network is necessary when
the deployment of a cable system is impossible or economically
impractical. Wireless networks have significant advantages over
wired ones [5, 11–12]: they allow deploying the network in places
where wires cannot be used and maintain a sufficient data transfer
rate. Wireless networks also provide easy connection, user mobility,
quick troubleshooting, and network equipment availability.
According to their size, the
wireless networks are divided into (Fig. 1) [5, 11–12]: Wireless
Personal Area Networks (WPAN) – up to 10 m; Wireless Local Area
Networks (WLAN) – up to 100 m; Wireless Metropolitan Area Networks
(WMAN) – up to 50 km; Wireless Wide Area Network (WWAN).
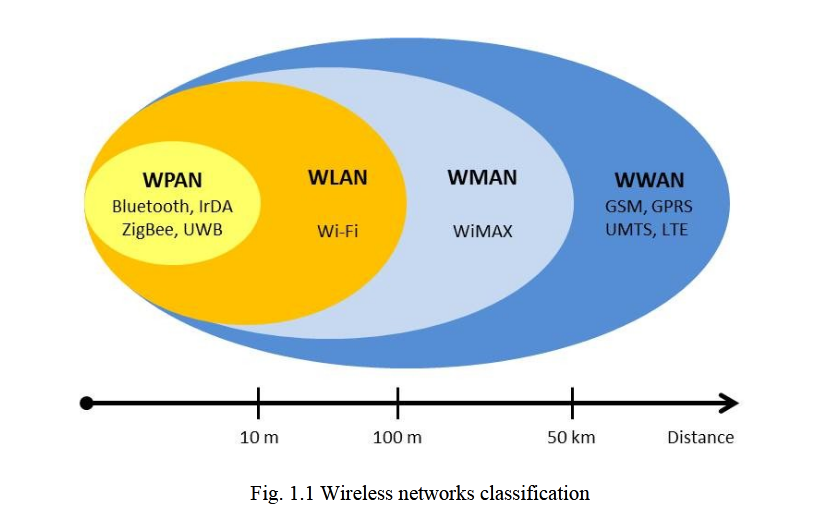
Fig.
1. Classification of wireless networks
According to the topology,
wireless local area networks are divided into ad-hoc temporary
networks (Independent Basic Service Set, IBSS); Basic Service Set
(BSS); Extended Service Set (ESS). It is known that there are two
main methodologies for WLAN deployment: wireless LAN with maximum
service area; wireless LAN with maximum capacity [5, 11–12].
Scientists such as Ye. S.
Skakov, V. M. Malysh, dealt with the planning of wireless
networks [1]. To solve this problem, it is possible to use
intelligent methods of multiagent optimization, which include bee,
ant, particle swarm, bat, fireflies and other algorithms [1, 2, 18].
The work [1] determines that the bee method is the most suitable for
solving the problem of locating base stations of a wireless network.
The bee method has some
modifications [7–8], one of which is BCOi (Bee Colony Optimization
based on the improvement concept). Its peculiarity is that the work
with complete solutions of the optimization problem is considered,
not with partial ones, as in the classical BCO method [1].
Since 2008, the GSM-R (Global
System for Mobile Communications – Railway) standard has been used
in European railways to ensure secure wireless communication between
railway services and trains [3, 6, 7, 16]. The GSM–R network is
used to provide the European Train Control System (ETCS) [16]. In
the UK, the GSM–R network has been fully operational since 2015
[16]. Today in Europe we are talking about transition to more modern
technologies such as 4G/LTE and 5G [19]. In the future, the
following new services are expected at railway transport: on-board
and roadside HD video surveillance, multimedia dispatcher video
streams, sensor information from railway infrastructure, including
bridges, viaducts, tunnels, track defects, etc. Using infrared,
sound and temperature sensors, information is collected and sent to
a computation center [4].
At the present stage in
Ukraine, research is being conducted on the information and
telecommunication system (ITS) of railway transport using artificial
intelligence methods [13–15, 20]: neural and fuzzy networks, ant
and genetic methods. But the results of the introduction of wireless
networks at railway transport are not sufficiently presented yet.
The authors considered the possibility of using WLAN technology for
the implementation of mobile communication at railway stations, made
a base station state chart in the Distributed Coordination
Function (DCF), which is mandatory and based on the protocol,
providing Carrier Sense Multiple Access with Collision Avoidance
(CSMA/CA). Now it is expedient to conduct
a study of the optimal
number of base stations of the wireless network, in particular at
the marshalling yard, which reaches the lower level (line
enterprises) of the ITS of the railway transport of Ukraine.
Purpose
In our work,
we plan to investigate the deployment of a wireless network and
search for the optimal number of base stations according to the bee
colony algorithm for marshalling yards
of different capacities. Phyton language was chosen for software
implementation.
Methodology
Problem
statement.
The marshalling yard
(Fig. 2) includes
arrival park, sorting park, hump and departure park. The most
important part of the technological process is the hump, the
capacity of which (small, medium, high and increased) depends on the
number of sorting sets (2, 3, 4, 6-8, respectively). At the object
under study there are various technological areas (point section,
speed measuring and cut acceleration in the section of 1–2
BP (brake position) and 3–4
BP, measuring cut parameters, uncoupling control, cut mass
determination) with various ground equipment: track sensors and
photodetectors; track circuits; weight measuring devices; radar
velocity meters and others.
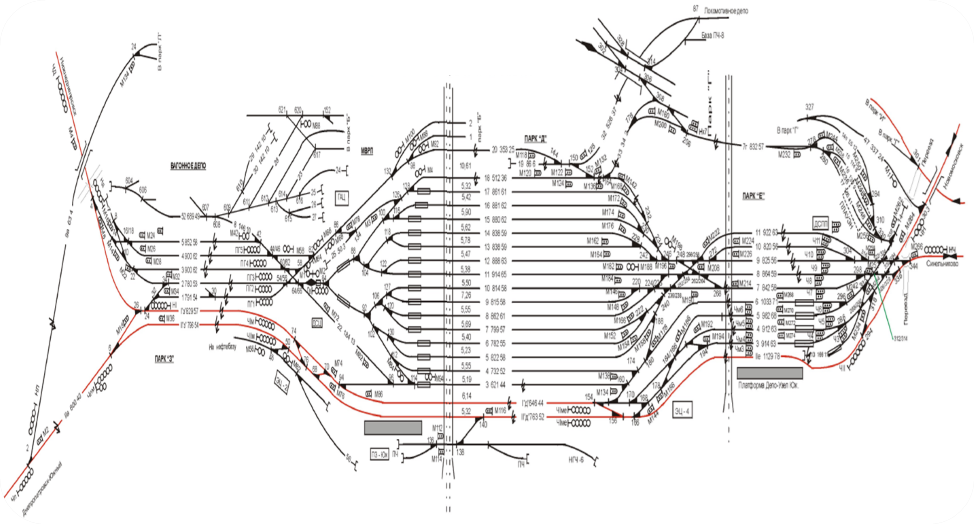
Fig. 2. Scheme of
marshalling yard
Let L
be the total number of clients to be connected to the wireless base
station at the marshalling yard. Known M – are the candidate
places where WLAN base stations can be installed. In addition, all
clients must be connected to base stations.
Let us
introduce the notation
 –
the i-th
base station of the wireless network with a coverage radius r,
to which k
clients are connected, where
–
the i-th
base station of the wireless network with a coverage radius r,
to which k
clients are connected, where
 ;
;
 .
If
.
If
 ,
then i-th
base station with k-clients
is connected to the WLAN, in other case
,
then i-th
base station with k-clients
is connected to the WLAN, in other case
 .
.
Let
us consider the following
function as a target
one:
 , (1)
, (1)
moreover, it
is necessary to comply
with the restrictions:
 ,
,
 , (2)
, (2)
Where
 – is
maximum coverage radius of the base
station WLAN;
– is
maximum coverage radius of the base
station WLAN;
 –
the maximum number of clients that are
connected to the WLAN base station.
–
the maximum number of clients that are
connected to the WLAN base station.
Wireless
network deployment at the marshalling yard. Given
the characteristics of the marshalling yard, in the future we are
talking about WLAN planning.
According to
the IBSS topology (Fig. 3) [5, 11–12], client stations interact
directly with each other without an access point. Ad Hoc mode
requires minimum of equipment – a wireless adapter. This
configuration does not require the creation of any network
infrastructure. In
this mode, each node participates in routing by sending data to
other nodes, so determining which nodes send data is done
dynamically based on the network connection and the routing
algorithm used. Ad-Hoc mode is used mainly to create temporary
networks.
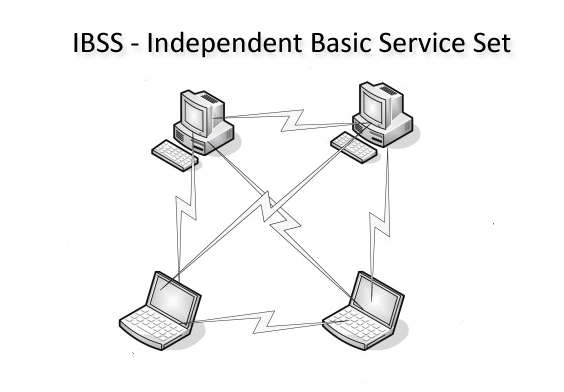
Fig.
3. IBSS topology
According to the BSS topology
(Fig. 4) [5, 11–12], network nodes interact with each other not
directly, but through an access point (AP), which can play the role
of a bridge for connection to external cable network. All base
stations in the network are interconnected by Distribution System
(DS), which can be radio or infrared waves.
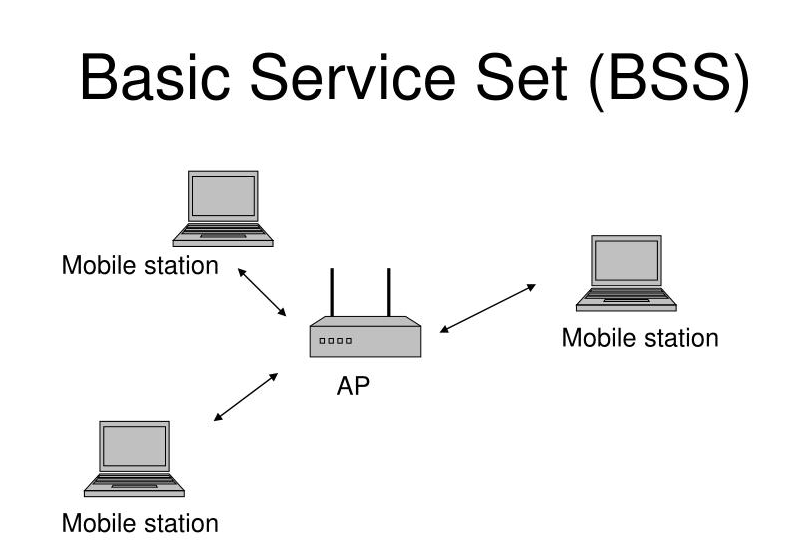
Fig.
4. BSS topology
The ESS topology (Fig. 5) [5,
11–12] makes it possible to combine several access points, i.e.
connects several BSS networks. In this case, the access points can
interact with each other. This topology is useful when you need to
connect multiple users to a single network or connect multiple wired
or wireless networks.
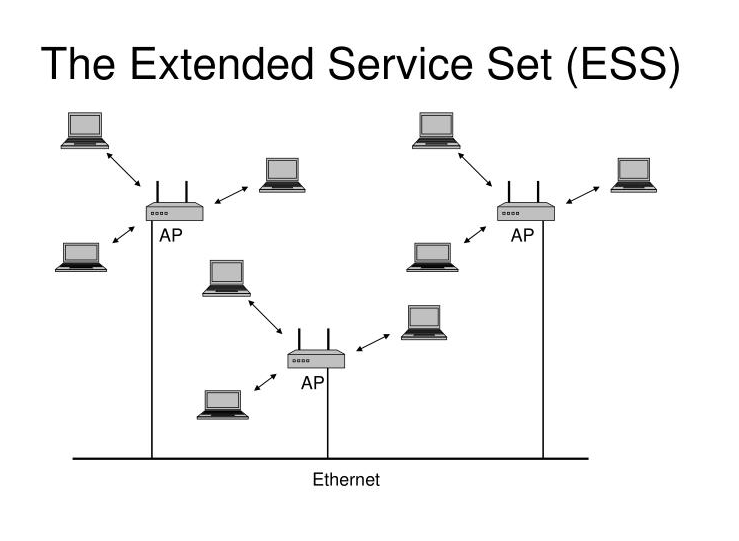
Fig.
5. ESS topology
It is advisable to use the ESS
topology at the marshalling yard, as you can use several access
points that interact with each other. In addition, there are wired
networks at the marshalling yard, with which it is necessary to
exchange information.
WLAN focused on the service
area are developed taking into account the provision of maximum
coverage with the minimum possible number of access points, Fig. 6.
[5, 11–12].
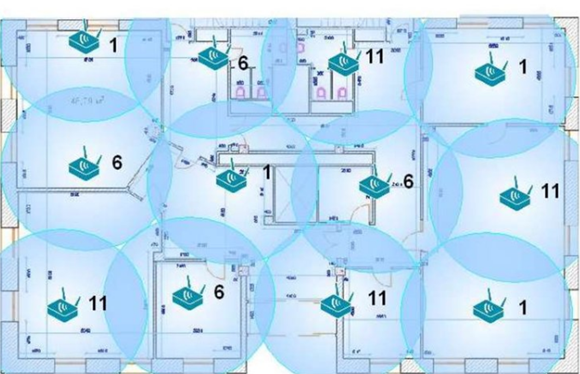
Fig.
6. Service area
oriented WLAN
In a typical service area
oriented network, the ratio of the number of users to the number of
access points is 25:1. Some typical features of WLAN are focused on
the maximum service area: the use of bursty applications with low
packet rate, for example, those generating requests to databases;
the need for low spectral bandwidth requirements, so that the data
flow rate can be reduced to a minimum of 1 and 2 Mbps; ensuring easy
maintenance, as WLAN maintenance staff is small. In service area
oriented networks, typical programs have low packet rate and low
spectral bandwidth requirements. This approach allows many users to
immediately access WLAN services while maintaining sufficient
characteristics of the latter. Such options are common for small or
medium-sized affiliates, when WLAN is chosen as an alternative to
wired Ethernet. Easy-to-deploy WLAN provide basic LAN connections
that are not required for file and printer sharing. Each WLAN access
point serves approximately 25–30 users [5, 11–12].
Wireless LAN that focus on high
bandwidth (Fig. 7) should provide maximum performance and packet
rate for each BSS client.
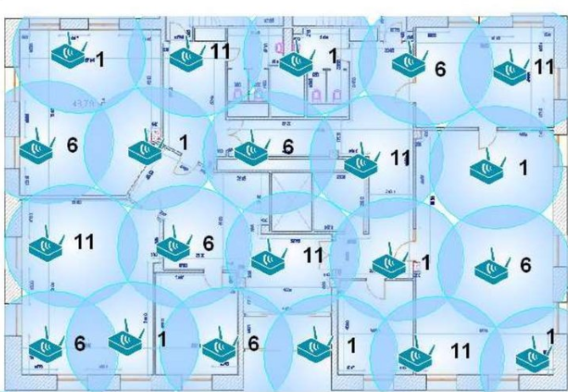
Fig.
7. WLAN focused on maximum
spectral
bandwidth
The cell size of the
bandwidth-oriented WLAN is smaller than that of the WLAN, which
focuses on the maximum service area, respectively, the location
density of access points is higher. High-bandwidth-oriented WLAN are
required when one uses applications that require high packet rates;
uses applications that are sensitive to delays; deploys subnets of
smaller scales (or several subnets in one service area); there is a
high density of user placement. In such networks, the number of
access points is several times greater than that for WLAN oriented
on service area. The service area of each access point is much
smaller than when building a network focused on the maximum
service area. Each access point serves about 12 users [5, 11–12].
For a marshalling yard, it is
advisable to use WLAN deployment methodologies that focus on maximum
bandwidth, wireless LAN should provide maximum performance and
packet rate for each client.
Choice of
organization algorithm of wireless network at marshalling yard.
Nowadays, there are many different swarm
algorithms, which can be divided into [2, 18]: swarm algorithms
based on the behavior of insects and animals; swarm algorithms based
on bacterial behavior and inanimate nature.
The first include the following
algorithms: particle swarm algorithm; ant algorithm; bee algorithm;
fireflies algorithms; cuckoo search algorithm; bat algorithm. The
second include gravitational search algorithm; intelligent drip
algorithm; stochastic diffusion search; bacterial optimization.
Particle
swarm algorithm is proposed to optimize continuous nonlinear
functions. Ant algorithm is one of the most efficient polynomial
algorithms for finding approximate solutions to route search
problems on graphs. Bee algorithm is a relatively new algorithm for
finding global extremums of complex multidimensional functions.
According to the bee algorithm, bees explore areas that are near
elite ones, which allows you to approximate the solution to optimal.
The advantage of the algorithm is the possibility of efficient
division into parallel processes and high speed [2].
Biological
bases of the bee method. Bees
in nature search for food by studying the space around their hive
(Fig. 8) [17].
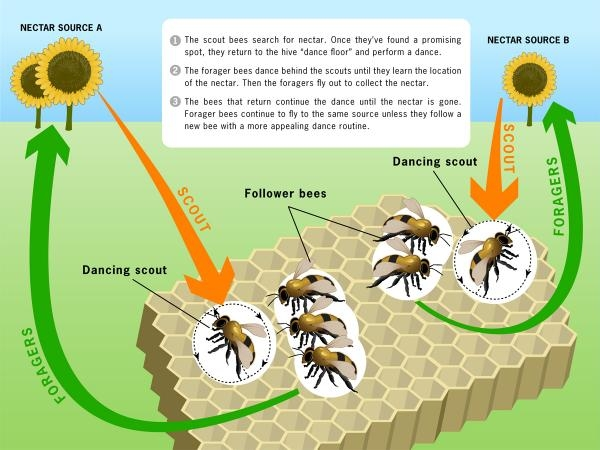
Fig.
8. Nature
analogue
Review of the sources [1–2,
8–10] showed that, as a rule, at the initial stage, several scout
bees study the environment. After the search, scout bees return to
the hive and inform the other members of the swarm about the
location, quantity and quality of available food sources that they
have found. The information exchange takes place with the help of
dance on a specially designated area. If a bee watching a skate
dance decides to leave the hive and collect nectar, it will follow
one of the scouts to one of the previously found food sources. Such
a bee becomes a busy forager. It collects nectar, while
clarifying information about the amount of nectar near the source
found. After collection, the forager returns to the hive and leaves
the nectar there. It can then do one of the following: become a free
forager, leaving its current source of nectar; continue extracting
nectar from its source without recruiting free bees by dancing;
continue extracting nectar from its source, while recruiting free
bees.
Described process continues
anabated, while the hive accumulates nectar and explores new areas
with potential food sources.
Bee
colony algorithm,
the enlarged scheme of which is
presented in Fig. 9 [10]. First the colony is initialized, then the
solution is searched, after which the bees exchange information in
the hive with the help of dance, then the colony is initialized
again until the stopping criterion is found, after which the optimal
solution is found.
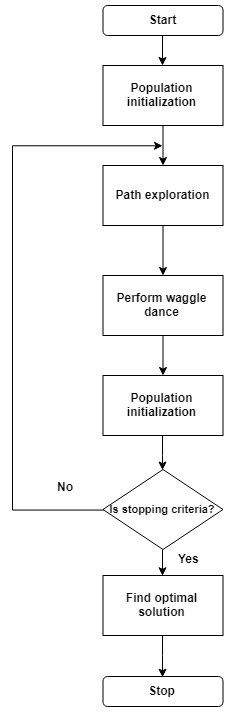
Fig.
9. Block diagram of the bee colony algorithm
Software
implementation of the bee colony algorithm is
performed in Python using standard libraries: Os – is responsible
for interaction with the OS; Sys – is responsible for system
functions; Random – is responsible for generating random numbers;
Math – is responsible for mathematical operations; Datetime – is
responsible for time conversion; Matplotlib – is responsible for
plotting.
The
structure of the LocBS-BeeCol software model includes the following
user classes (Fig. 10): Log – used to debug the program and
display the results, it is the parent for all classes; Field is a
class for presenting a marshalling yard, where the search for base
station location is performed; Hive is a hive class where bee-scouts
exchange information and choose the optimal solution, the parent
class is Field; Bee is a class of scout bees looking for coordinates
of base stations, the parent class is Hive.
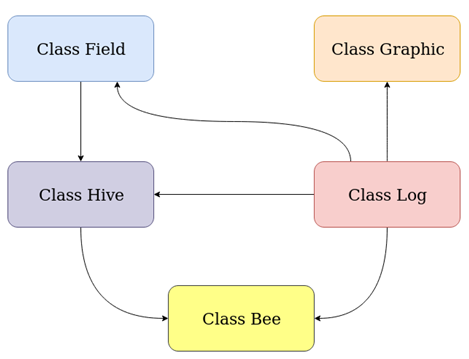
Fig. 10. Interaction of
the main classes
of LocBS-BeeCol
The location
of base stations (BS) at the marshaling yard is based on the
algorithm, which is the basis of the LocBS-BeeCol software model and
the scheme of which is shown in Fig. 11. First, all classes are
initialized. This is followed by a cycle with the premise: whether
all customers are covered by base stations. If not, then it is
performed the clearing of extremum values, detection of search area
coordinates for each bee, then the search for clients in a certain
area and the coordinates of the base station are determined, at the
end of the cycle the found clients are deleted from the list of free
clients. If all clients are covered by base stations, the result
will be displayed as a dictionary, the volume of which is the number
of BS (res[bs_count]),
and consists of structures whose fields are the location of the BS
(new_bs_location), the number of clients (clients_in_area) covered
by this BS, and numbers of these clients with coordinates
(clients_in_area_list) in the form of dictionaries.
Fig. 12
shows a corresponding fragment of the program. In the For cycle
(line 28) the required number of bees is created, according to the
initial conditions. After creating everything necessary for the work
of program, the implementation of the algorithm itself begins. Line
30 starts the While cycle until all clients are connected to the
base stations. Inside, the For cycle (line 32) takes place, in which
the extremums and positions for each of the bees are reset to zero
(lines 33–35).
After specifying the search field (line 36), each bee makes a
given number of attempts to find the optimal solution for the
location of the base station (line 37). As a result of the cycle
iteration, the global extremum, where it is more expedient to
install the base station can be found, in this case it will be
installed (line 40). Next, the client numbers that are connected to
the BS (lines 41-42) are deleted from the general list, and the
cycle returns to the beginning.
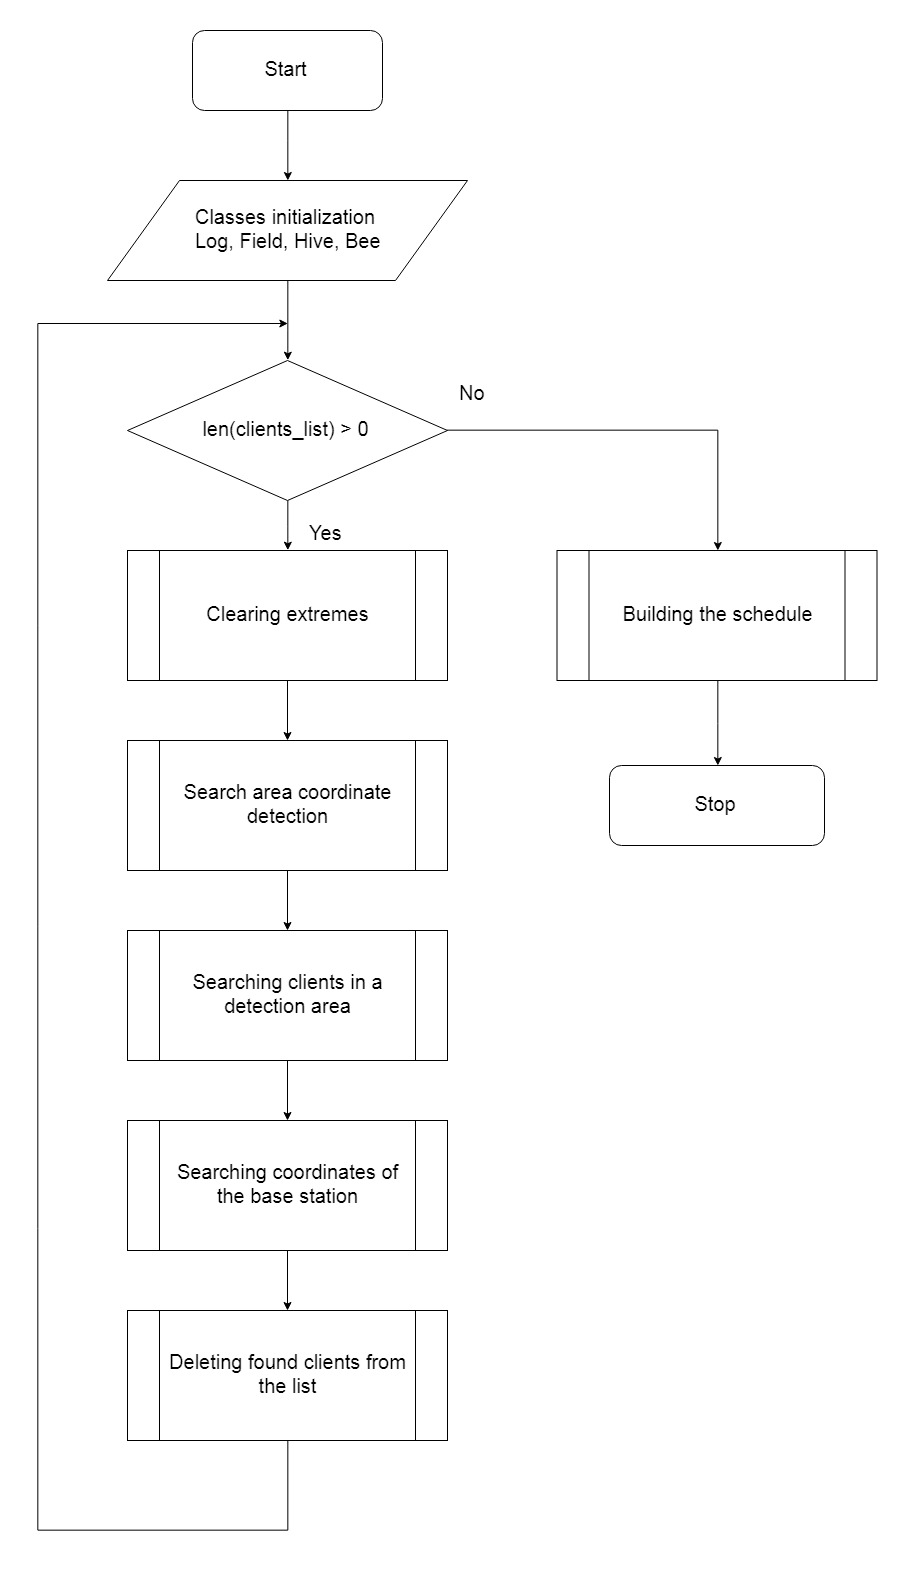
Fig.
11. LocBS-BeeCol model algorithm scheme
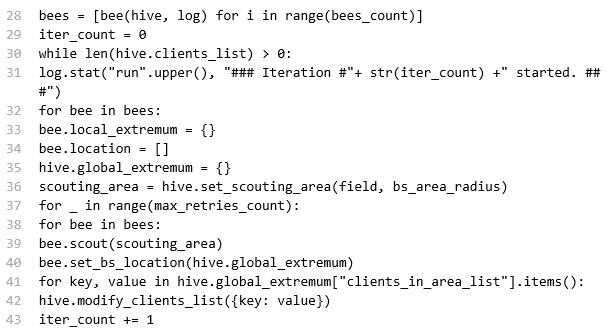
Fig.
12. LocBS–BeeCol
program model
fragment
Findings
Determining
the number of BS at the marshalling yard of small capacity. Input
parameters: number of bees (bees_count) = 10; maximum number of
attempts to find the optimal solution (max_retries_count) = 10;
number of clients (clients_count) = 250; maximum number of clients
covered by one WLAN base station (bs_max_clients_count) = 12;
coverage radius (bs_area_radius) = 50; field width (field_width) =
2,000; field height (field_height) = 400. The results of the model
work are shown in Fig. 13.
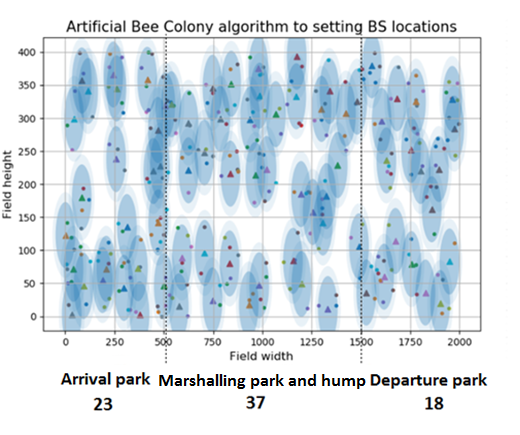
Fig.
13. BS location
at the marshalling yard
of small capacity
Thus, the
recommended number of BS for a small-capacity marshalling yard
is 78, 23 of which are in the arrival park, 37 –
in the sorting park and the hump, 18 –
in the departure park.
Determining
the number of BS at the marshalling yard of medium capacity.
Input
parameters:
number of
bees
(bees_count)
= 10; maximum number of attempts to find
the optimal solution (max_retries_count)
= 10; number of clients (clients_count)
= 300; maximum number of clients covered
by one WLAN base station (bs_max_clients_count)
= 12; coverage radius (bs_area_radius)
= 50; field width (field_width)
= 2 500; field height (field_height)
= 500. The results of the model work are
shown in Fig. 14.
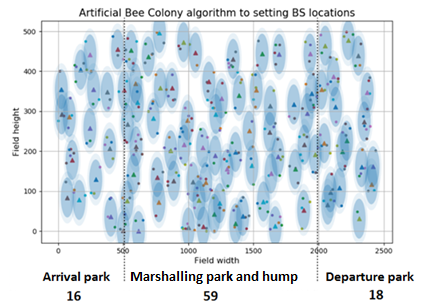
Fig.
14. BS location
at the marshalling yard
of medium capacity
Recommended
number of BS for a medium-capacity marshalling yard is 93, 19 of
which are in the arrival park, 59 – in
the sorting park and the hump, 18 – in
the departure park.
Determining
the number of BS at the marshalling yard of high capacity.
Input
parameters:
number of
bees
(bees_count)
= 10; maximum number of attempts to find
the optimal solution (max_retries_count)
= 10; number of clients (clients_count)
= 350; maximum
number of clients covered by one WLAN base station
(bs_max_clients_count)
= 12; coverage radius (bs_area_radius)
= 50; field width (field_width)
= 3 000; field
height (field_height)
= 600. The
results of the model work are shown in Fig.
15.
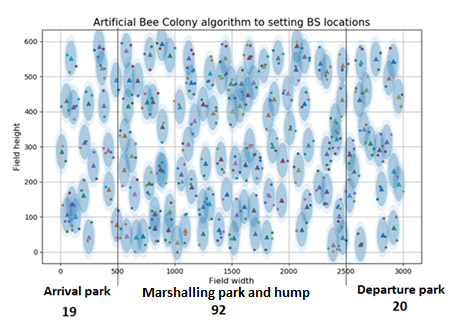
Fig.
15. BS location at the marshalling yard
of high capacity
Recommended
number of BS for a high-capacity marshalling yard is 131, 19 of
which are in the arrival park, 92 – in
the sorting park and the hump, 20 – in
the departure park.
Originality
and practical value
Investigation
of algorithm parameters.
The quality of the obtained solutions largely depends on the choice
of algorithm parameters. Therefore, a study was conducted to
identify the dependences of the optimization results (the number of
BS of wire network) and the time to find the optimal solution for
different numbers of bees and attempts for marshalling yards (MS) of
different capacity. The results are presented in Fig. 16–19.
Fig. 16–17
show that increase in the number of bees (from 10 to 50) and the
number of attempts to find the optimal solution by one bee (from 10
to 50) leads to a decrease in the number of WLAN base stations by an
average of 6.5 and 9.3% respectively.
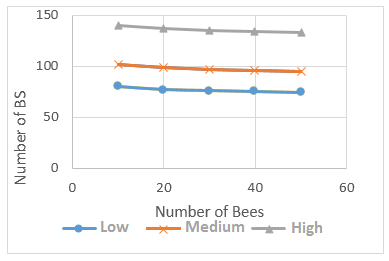
Fig. 16.
Optimization results dependence
(number of BS) on the number of
bees
for MS of different capacity
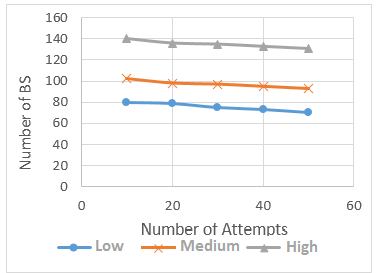
Fig.
17. Optimization results dependence
(number of BS) on the
number of attempts
for MS of different capacity
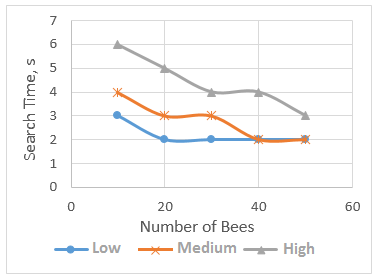
Fig.
18. Dependence of the optimal solution
search time on the number
of bees for MS of various capacity
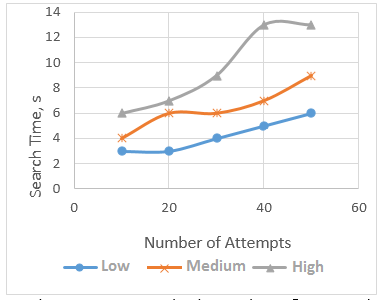
Fig.
19. Dependence of the optimal solution search time on the
number of bees for MS of various capacity
Increasing
the number of bees (from 10 to 50) reduces the search time for the
optimal solution by bees by an average of 1.8 times (Fig. 18), while
increasing the number of attempts to find the optimal solution for
one bee (from 10 to 50 ) leads to an increase in the time to find
the optimal solution by an average of 2.14 times (Fig. 19).
Investigation
of the coverage radius of the WLAN base station
was performed for a high-capacity marshalling yard. The obtained
results on the LocBS-BeeCol software model are summarized in Tab. 1.
Table 1
The investigation
results for high-capacity
marshalling yard
|
No.
of investigation
|
BS
coverage radius, m
|
BS
number
|
Solution
search time, sec
|
|
1
|
50
|
135
|
22
|
|
2
|
|
135
|
20
|
|
3
|
|
133
|
19
|
|
4
|
|
140
|
22
|
|
5
|
|
138
|
20
|
|
|
Average:
|
136.2
|
20.6
|
|
1
|
100
|
67
|
8
|
|
2
|
|
61
|
7
|
|
3
|
|
62
|
9
|
|
4
|
|
63
|
9
|
|
5
|
|
66
|
9
|
|
|
Average:
|
63.8
|
8.4
|
The Table shows that twofold
increase in the base station coverage radius (from 50 to 100 m)
leads to a decrease in the number of BS approximately twice (from
136 to 64), while the search time for the solution of bees increases
2.5 times (from 8.4 to 20.6 sec). The study was conducted with the
following parameters: the number of bees (bees_count) = 10; maximum
number of attempts to find the optimal solution (max_retries_count)
= 10; number of clients (clients_count) = 350; maximum number of
clients covered by one base station (bs_max_clients_count) = 12;
field width (field_width) = 3,000; field height (field_height) =
600.
Conclusions
Taking into
account the topology of the marshalling yard and the peculiarities
of the relevant technological process, it is advisable to use
a
wireless local area network of the ESS topology with WLAN
deployment methodology, focused on maximum bandwidth.
Based on
the results of the review of scientific sources to determine the
optimal number of WLAN base stations and their location at the
marshalling yard, the bee method was used, the advantages of which
include the possibility of effective division into parallel
processes; high speed work.
Based on
the bee colony algorithm in Python, the corresponding LocBS-BeeCol
software model was compiled, the input data of which are as
follows: marshalling yard parameters (area, number of clients to be
connected to base stations); WLAN parameters (base station coverage
radius; number of clients served by the base station); the bee
colony algorithm parameters (number of bees, number of attempts to
find the optimal solution by the bee). For example, to connect 300
clients to a medium-capacity marshalling yard with an area of
2 500x500 m2,
93 base stations with a coverage radius of 50 m are required.
The quality
of the obtained solutions largely depends on the choice of the bee
colony algorithm parameters. A study of the number of WLAN base
stations (solution search time by the bees) on the different number
of bees (attempts to find the optimal solution by bees) for
marshalling yards of different capacity. It is determined that
increase in the number of bees and the number of attempts to find
the optimal solution by the bee leads to an increase in the quality
of the optimal solution – decrease in the number of base
stations. In addition, increase in the number of bees leads to a
decrease in the time to find the optimal solution and increase in
the number of attempts will lead to an increase in the time to find
the optimal solution by bees.
For a
high-capacity marshalling yard in the case of increasing the
coverage radius of the WLAN base station twice the number of BS is
reduced by about two times, while the time to find the optimal
solution for bees increases
2.5 times.
List of reference links
Скаков Е. С.,
Малыш В. Н. Пчелиный
алгоритм оптимизации для решения
задачи планирования беспроводной
сети. Программные
продукты и системы. 2016. № 4 (67). С.
67–73.
DOI: 10.15827/0236-235X.115.067-073
Смирнова
О. С., Богорадникова А.
В., Блинов М. Ю. Описание роевых алгоритмов,
инспирированных неживой природой и
бактериями, для использования в
онтологической.
International Journal of Open Information
Technologies.
2015. Vol. 3, No. 12. С. 28–37.
Ahamed
A., Islam N.,
Soikot M. A. S., Hossen M. S., Ahmed R., Hasan M. A. Train
Collision Avoidance
Using GPS and GSM Module.
2019
International Conference on Power
Electronics, Control and Automation (ICPECA).
2019. P. 1–4. DOI:
10.1109/icpeca47973.2019.8975543
Ai
B., Guan K., Rupp M., Kurner T., Cheng X., Yin X.-F., … Ding
J.-W. Future railway services-oriented mobile communications
network. IEEE
Communications Magazine. 2015. Vol.
53. Iss. 10. P. 78–85.
DOI: 10.1109/MCOM.2015.7295467
A
Brief Overview of the Wireless World.
URL:
https://www.sciencedirect.com/topics/computer-science/basic-service-set.
(date of access:
13.12.2019).
A Necessary GSM-R Mobile Upgrade. URL:
https://www.railengineer.co.uk/2019/03/13/a-necessary-gsm-r-mobile-upgrade.
(date of
access: 13.12.2019).
Banerjee
S., Hempel N., Sharif H. A Survey of Wireless Communication
Technologies & Their Performance for High Speed Railways.
Journal
of Transportation Technologies.
2016. Vol. 06. Iss. 01. P. 15–29.
DOI: 10.4236/jtts.2016.61003
Davidovic
T., Teodorovic
D., Selmic M. Bee Colony Optimization – Part I : The Algorithm
Overview : Invited survey.
YJOR.
2015. Vol. 25. Iss. 1. P.
33–56.
DOI: 10.2298/YJOR131011017D
Hussein
W. A., Sahran S.,
Sheikh Abdullah S. N. H. The variants of the Bees Algorithm (BA) :
A survey. Artificial
Intelligence Review.
2017.
Vol. 47.
Iss. 1. P. 67–121.
DOI:
10.1007/s10462-016-9476-8
Kumar
K., Zindani D.,
Davim J. P. Bees Algorithm. Optimizing
Engineering Problems through Heuristic Techniques.
2019. P. 43-50. DOI: 10.1201/9781351049580-5
Nurmi
J., Lohan E.-S., Wymeersch H., Seco-Granados G., Nykänen O.
Multi-Technology Positioning.
Sprin-ger International Publishing AG.
2017. 348 p.
DOI: 10.1007/978-3-319-50427-8
Osterhage
W. Wireless
Network Security. Taylor & Francis
Group. 2018. P. 14–77.
DOI: 10.1201/9781315106373-3
Pakhomova V. M.,
Skaballanovich T. I., Bondareva
V. S.
Intelligent routing in the network of
information and telecommunication system of railway transport.
Наука та прогрес
транспорту. 2019.
№ 2 (80). P.
77–90.
DOI: 10.15802/stp2019/166092
Pakhomova
V. M., Tsykalo
I. D. Optimal route definition in the network based on the
multilayer neural model.
Наука та прогрес
транспорту. 2018. № 6
(78). P.
126–142. DOI:
10.15802/stp2018/154443
Pakhomova
V. M., Mandybura
Y. S. Optimal route definition in the railway information network
using neural-fuzzy models.
Наука та прогрес транспорту.
2019. № 5 (83).
P.
81–98.
DOI: https://doi.org/10.15802/stp2019/184385
Sneps-Sneppe
M.,
Namiot
D.
Digital
Railway and How to Move from GSM-R to LTE-R and 5G.
Convergent
Cognitive Information Technologies.
2018. P. 392–402. DOI:
10.1007/978-3-030-37436-5_34
Vaishali
S. Nature – All Mathematics. URL:
http://thebridge.psgtech.ac.in/index.php/2014/11/12/nature-all-mathematics.
(date of
access: 13.12.2019).
Ying
Tan. Survey
of swarm
intelligence.
Swarm
Intelligence Vol.
1 : Principles,
current
algorithms
and
met-hods.
2018. P. 1–28.
DOI: 10.1049/pbce119f_ch11
Zhong
Z.-D., Ai B., Zhu G., Wu H., Xiong L., Wang F.-G., … He R.-S. Key
Issues for GSM-R and LTE-R. Dedicated
Mobile Communications for High-speed Railway.
2018.
P. 19–55. DOI: 10.1007/978-3-662-54860-8_2
Zhukovyts’kyy
I., Pakhomova
V. Research of
Token Ring network options in automation system of marshalling
yard. Transport
Problems. 2018. Vol. 13. Iss. 2.
P. 149–158.
DOI: 10.20858/tp.2018.13.2.14
В. М. ПАХОМОВА1*,
Д. І. Назарова2*
1*Каф.
«Електронні обчислювальні машини»,
Дніпровський національний університет
залізничного транспорту імені академіка
В. Лазаряна, вул. Лазаряна, 2, Дніпро,
Україна, 49010, тел. +38 (056) 373 15 89, >ел. пошта
viknikpakh@gmail.com, ORCID 0000-0002-0022-099X
2*Каф.
«Електронні обчислювальні машини»,
Дніпровський національний університет
залізничного транспорту імені академіка
В. Лазаряна, вул. Лазаряна, 2, Дніпро,
Україна, 49010, тел. +38 (056) 373 15 89, ел. пошта
olkdi@outlook.com, ORCID 0000-0002-7134-9416
організація
бездротової мережі
на сортувальній
станції з
використанням бджолиного
методу
Мета. Сьогодні
бездротові мережі широко використовують
в якості альтернативи дротовим, що
дозволяє підключити декілька пристроїв
як між собою в локальну, так і до
глобальної мережі Інтернет. Але на
сучасному етапі в Україні немає масового
використання бездротової мережі на
залізничному транспорті, тому доцільно
провести дослідження розгортання такої
мережі, зокрема на сортувальній станції.
Методика.
На програмній моделі «LocBS–BeeCol»,
що створена мовою Python
за алгоритмом бджолиної колонії,
визначено оптимальну кількість базових
станцій (БС) бездротової мережі та їх
розташування на сортувальній станції,
проведено дослідження параметрів
алгоритму. Вхідні дані моделі
«LocBS–BeeCol»:
параметри сортувальної станції (площа,
кількість клієнтів, яких
потрібно підключити до базових станцій);
параметри бездротової мережі (радіус
покриття базової станції, максимальна
кількість клієнтів для однієї базової
станції); параметри алгоритму бджолиної
колонії (кількість бджіл-розвідників,
кількість спроб знайти оптимальне
рішення одною бджолою). Результати.
Для сортувальних
станцій різної потужності (малої,
середньої та великої) отримано оптимальну
кількість базових станцій бездротової
мережі за обмежень на радіус покриття
базової станції та кількість клієнтів,
що підключені до неї. Так,
наприклад, для підключення 300
клієнтів на сортувальній
станції середньої потужності, площа
якої 2 500x500 м2,
необхідно 93 базових станції з
радіусом покриття 50 м. Наукова
новизна. Якість
отриманих рішень значною мірою залежить
від вибору параметрів алгоритму
бджолиної колонії.
Проведено дослідження кількості базових
станцій бездротової
мережі та часу пошуку
оптимального
рішення за різною кількістю бджіл та
кількістю спроб знайти оптимальне
рішення бджолою для сортувальних
станцій різної потужності. Визначено,
що збільшення кількості бджіл (із 10 до
50) та кількості спроб знаходження
оптимального рішення бджолою (із 10
до 50) призводить до уточнення оптимального
рішення (зменшення числа базових станцій
у середньому на 6,5 та 9,3 % відповідно).
Крім того, збільшення кількості бджіл
(із 10 до 50) призводить до зменшення часу
пошуку оптимального
рішення бджолами в середньому в 1,8 раза,
у той час як збільшення кількості спроб
знаходження оптимального рішення
бджолою (із 10 до 50) призведе до зростання
часу пошуку оптимального
рішення в середньому в 2,14 раза.
Практична значимість.
Розроблено алгоритм та його програмну
реалізацію, які дозволяють визначити
необхідну кількість базових станцій
та їх розміщення під час розгортання
бездротової мережі на сортувальній
станції. Для сортувальної станції
великої потужності в разі збільшення
радіуса покриття
базової станції удвічі
(із 50 до 100 м) кількість БС зменшується
приблизно в два рази (зі
136 до 64), при цьому час пошуку оптимального
рішення бджолами збільшується в 2,5
раза (із 8,4 до 20,6 с).
Ключові слова: сортувальна станція;
бездротова мережа; базова станція (БС);
радіус покриття; бджолиний метод;
бджоли; спроби; час пошуку
В. Н. ПАХОМОВА1*,
Д. И. НАЗАРОВА2*
1*Каф.
«Электронные вычислительные
машины», Днипровский
национальный университет
железнодорожного транспорта имени
академика В. Лазаряна, ул. Лазаряна, 2,
Днипро, Украина, 49010, тел. +38 (056) 373 15 89,
эл. почта viknikpakh@gmail.com, ORCID
0000-0002-0022-099X
2*Каф. «Электронные
вычислительные машины», Днипровский
национальный университет железнодорожного
транспорта имени академика В. Лазаряна,
ул. Лазаряна, 2, Днипро, Украина, 49010, тел.
+38 (056) 373 15 89, эл. почта olkdi@outlook.com, ORCID
0000-0002-7134-9416
ОРГАНИЗАЦИЯ БЕСПРОВОДНОЙ СЕТИ
НА СОРТИРОВОЧНОЙ СТАНЦИИ
С ИСПОЛЬЗОВАНИЕМ
ПЧЕЛИНОГО МЕТОДА
Цель.
Сегодня беспроводные сети широко
используют в качестве альтернативы
проводным, что позволяет подключить
несколько устройств как между собой в
локальную, так и к глобальной сети
Интернет. Однако на современном этапе
в Украине нет массового использования
беспроводной сети на железнодорожном
транспорте, поэтому целесообразно
провести исследование развертывания
такой сети, в частности, на сортировочной
станции. Методика.
На программной модели «LocBS–BeeCol»,
написанной на языке Python по алгоритму
пчелиной колонии, определено оптимальное
количество базовых станций (БС)
беспроводной сети и их расположение
на сортировочной станции, проведено
исследование параметров алгоритма.
Входные данные модели «LocBS–BeeCol»:
параметры сортировочной станции
(площадь, количество клиентов, которы
нужно подключить к базовым станциям);
параметры беспроводной сети (радиус
покрытия базовой станции, максимальное
количество клиентов для одной базовой
станции); параметры алгоритма пчелиной
колонии (количество пчел-разведчиков,
количество попыток найти оптимальное
решение одной пчелой).Результаты.
Для сортировочных станций различной
мощности (малой, средней и высокой)
получено оптимальное количество базовых
станций беспроводной сети при ограничениях
на радиус покрытия базовой станции и
количество клиентов, подключенных к
ней. Так, например, для подключения 300
клиентов на сортировочной станции
средней мощности, площадь которой
2 500x500 м2,
необходимо 93 базовых станций с радиусом
покрытия 50 м. Научная
новизна. Качество
полученных решений в значительной мере
зависит от выбора параметров алгоритма
пчелиной колонии. Проведено исследование
количества базовых станции беспроводной
сети и времени поиска оптимального
решения при различном числе пчел и
количестве попыток найти оптимальное
решение пчелой для сортировочных
станций различной мощности. Определено,
что увеличение количества пчел (с 10 до
50) и количества попыток нахождения
оптимального решения пчелой (с 10 до 50)
приводит к уточнению оптимального
решения (уменьшению числа базовых
станций в среднем на 6,5 и 9,3 % соответственно).
Кроме этого, увеличение количества
пчел (с 10 до 50) приводит к уменьшению
времени поиска оптимального решения
пчелами в среднем в 1,8 раза, в то время
как увеличение количества попыток
нахождения оптимального решения пчелой
(с 10 до 50) приведет к росту времени поиска
оптимального решения в среднем в 2,14
раза. Практическая
значимость. Разработан
алгоритм и его программная реализация,
позволяющие определить необходимое
количество базовых станций и их
размещение при развертывании беспроводной
сети на сортировочной станции. Для
сортировочной станции высокой мощности
при увеличении радиуса покрытия базовой
станции вдвое (с 50 до 100 м) количество
БС уменьшается примерно в два раза (со
136 до 64), при этом время
поиска оптимального решения пчелами
увеличивается в 2,5 раза (с
8,4 до 20,6 с).
Ключевые слова: сортировочная
станция; беспроводная сеть; базовая
станция (БС); радиус покрытия; пчелиный
метод; пчелы; попытки;
время поиска
REFERENCES
Skakov,
E., & Malysh,
V. (2016). Bee
optimization algorithm for solving wireless network planning
problem. Software products and
systems.,
4(67),
67-73. DOI:
10.15827/0236-235X.115.067-073 (in
Russian)
Smirnova,
O., Bogoradnikova,
A. & Blinov,
M. (2015). Description of swarm
algorithms inspired by inanimate nature and bacteria for use in the
ontological model. International
Journal of Open Information Technologies,
3(12), 28-37. (in Russian)
Ahamed, A., Islam, N., Soikot, M. A. S., Hossen,
M. S., Ahmed, R., & Hasan, M. A. (2019). Train Collision
Avoidance Using GPS and GSM Module. 2019
International Conference on Power Electronics, Control and
Automation (ICPECA), 1-4. DOI:
10.1109/icpeca47973.2019.8975543 (in English)
Ai, B., Guan, K., Rupp, M., Kurner, T., Cheng,
X., Yin, X.-F., …&
Ding, J.-W. (2015). Future railway services-oriented mobile
communications network. IEEE
Communications Magazine, 53(10),
78-85. DOI: 10.1109/MCOM.2015.7295467
(in English)
A
Brief Overview of the Wireless World. Retrieved
from
https://www.sciencedirect.com/topics/computer-science/basic-service-set
A
Necessary GSM-R Mobile Upgrade. Retrieved
from
https://www.railengineer.co.uk/2019/03/13/a-necessary-gsm-r-mobile-upgrade
Banerjee,
S., Hempel, M., & Sharif, H. (2016). A Survey of Wireless
Communication Technologies & Their Performance for High Speed
Railways. Journal
of Transportation Technologies, 06(01),
15-29 DOI: 10.4236/jtts.2016.61003 (in
English)
Davidovic,
T., Teodorovic, D. &
Selmic, M. (2015). Bee Colony Optimization – Part I: The
Algorithm Overview: Invited survey.
Yugoslav Journal of Operations
Research, 25(1),
33-56. DOI: 10.2298/YJOR131011017D
(in English)
Hussein,
W. A., Sahran, S., & Sheikh Abdullah, S. N. H. (2017). The
variants of the Bees Algorithm (BA):
a survey. Artificial
Intelligence Review, 47(1), 67-121
DOI:
10.1007/s10462-016-9476-8
(in English)
Kumar,
K., Zindani, D., & Davim, J. P. (2019). Bees
Algorithm. Optimizing Engineering
Problems through Heuristic Techniques. DOI:
10.1201/9781351049580-5 (in English)
Nurmi,
J., Lohan, E.-S., Wymeersch, H., Seco-Granados, G., & Nykänen,
O. (2017). Multi-Technology
Positioning. Springer
International Publishing AG.
DOI: 10.1007/978-3-319-50427-8
(in English)
Osterhage,
W. (2018). Wireless
Network Security. Taylor
& Francis Group, 14-77.
DOI: 10.1201/9781315106373-3
(in English)
Pakhomova,
V. M., Skaballanovich, T. I., & Bondareva, V. S. (2019).
Intelligent routing in the network of information and
telecommunication system of railway transport. Science
and Transport Progress, 2(80),
77-90. DOI:
10.15802/stp2019/166092
(in English)
Pakhomova,
V. M., & Tsykalo, I. D. (2018). Optimal route definition in the
network based on the multilayer neural model. Science
and Transport Progress, 6(78),
126-142.
DOI: 10.15802/stp2018/154443
(in English)
Pakhomova,
V. M., & Mandybura, Y. S. (2019). Optimal route definition in
the railway information network using neural-fuzzy models. Science
and Transport Progress, 5(83), 81-98.
DOI: 10.15802/stp2019/184385
(in English)
Sneps-Sneppe,
M., & Namiot, D. (2020). Digital
Railway and How to Move from GSM-R to LTE-R and 5G.
Convergent Cognitive Information Technologies,
392-402.
DOI:
10.1007/978-3-030-37436-5_34
(in English)
Vaishali,
S. Nature-All-Mathematics.Retrieved from
http://thebridge.psgtech.ac.in/index.php/2014/11/12/nature-all-mathematics
Ying,
Tan. (2018).
Survey of swarm
intelligence. Swarm
Intelligence-Vol.
1: Principles, current
algorithms and
methods, 1-28. DOI:
10.1049/pbce119f_ch1
(in English)
Zhong,
Z.-D., Ai, B., Zhu, G., Wu, H., Xiong, L., Wang, F.-G., … &
He, R.-S. (2017). Key
Issues for GSM-R and LTE-R.
Dedicated Mobile Communications for High-Speed Railway, 19-55.
DOI: 10.1007/978-3-662-54860-8_2
(in English)
Zhukovyts’kyy,
I., & Pakhomova,
V. (2018). Research of Token Ring network
options in automation system of marshalling yard. Transport
Problems, 13(2),
149-158.
DOI: 10.20858/tp.2018.13.2.1
(in English)
Received: November 19, 2019
Accepted: March 17, 2020