ISSN
2307–3489 (Print), ІSSN
2307–6666
(Online)
Наука
та прогрес транспорту. Вісник
Дніпропетровського
національного університету залізничного
транспорту, 2019,
№ 3 (81)
ЗАЛІЗНИЧНА
КОЛІЯ ТА АВТОМОБІЛЬНІ ДОРОГИ
UDC
625.1.032.43
О. M.
PATLASOV1,
E. M. FEDORENKO2*
1Dep.
«Track and Track Facilities», Dnipro
National University of Railway
Transport named after Academician V.
Lazaryan, Lazaryan St., 2, Dnipro,
Ukraine, 49010, tel. +38 (056) 373
15 42, e-mail am_patlasov@ukr.net,
ORCID 0000-0003-2081-5648
2*Dep. «Track and
Track Facilities», Dnipro National University of Railway
Transport
named after Academician V. Lazaryan, Lazaryan St., 2, Dnipro,
Ukraine, 49010, tel. +38 (066) 868 53 59 , e-mail
rapunzeeelliza@gmail.com,
ORCID 0000-0002-7518-9106
IMPACT OF CARS WITH 25 TF/AXLE
LOAD
ON THE TRACK CONDITION
Purpose. The research is aimed at determining
changes in the state of the geometrical parameters of the railway
track, depending on the passing tonnage in dynamic interaction with
the 25 tf/axle load rolling stock. Methodology. For data
acquisition, the authors carried out a statistical analysis of the
indicators of digital measurements of the track condition by KVL-P
track-measuring cars. Using the program of calculating the
mean-square deviation of the geometric parameters of the track, the
deviation of the track parameters within the test sections was
estimated. Findings. During the observation period it was
found that on average the intensity of track strain accumulation
increases. However, according to the results of the factor dispersion
analysis with 0.95 probability, it is impossible to unequivocally
state the impact of the factor of using the cars with an axial load
of up to 25 tf/axle on the deterioration of the track condition
parameters. Herewith it should be noted that the share of cargo
carried in the cars with axial load of up to 25 tf/axle during the
observation period was less than one per cent. According to the
values of the mean-square deviation, the state of the geometrical
parameters of the track and their predicted changes were estimated,
which showed that the increased axial load will lead to decreased
life of the rails, which are the most expensive elements of the track
structure, shortened service life of the railroad switches and
increased labor costs for workers involved in track repair and
maintenance. The corresponding reduction of inter-repair periods,
which corresponds to the standards, is projected. In order for
heavy-duty wagons not to destroy the infrastructure, there must be at
least two limitations: by the types of goods transported and by the
speed of movement. Originality.
The authors conducted a study to assess the impact of cars
with 25 tf/axle load on the state of the geometric parameters of the
railway track and proposed solutions to the issue of introducing the
25 tf/axle load rolling stock in Ukraine. Practical value. On
the basis of the obtained results it is possible to estimate the
impact of the axial load on the intensity of the track condition
changes and to predict the reduction of inter-repair periods in
connection with the track deterioration and in accordance with the
train speed restriction.
Keywords: railway
track; cost
standards; stress;
vertical and
lateral forces;
axle load
Introduction
The
increase in freight capacity on the Ukrainian railways is closely
related to increased axle load. In recent years, in many countries
of the European Union (EU) with 1520 mm gauge, the axle load is 25
tf/axle in accordance with the technical specifications [8]. In
addition to the EU, such axle load was introduced by the countries
neighboring to Ukraine, namely Russia, Byelorussia, the Baltic
States.
In
Ukraine, the axle load is 23.5 tf/axle, which is a restraining
factor in the organization of transit freight transportation. In
addition, at present, Ukraine already has a rolling stock with an
axle load of 25 tf/axle, which must meet the conditions of wear-life
and durability. In the case of limited funding, the introduction of
axle load of 25 tf/axle can lead to a significant deterioration of
the track and hence to the restriction of train speed, as reflected
in the
scientific works
of domestic
and foreign
scientists [1,
2, 3,
4, 13,
14–19,
20].
Taking
into account
the above,
increase in the
axial load
can lead
to increased
costs for
materials and
labor, which
will undermine
the introduction
of heavy
cars.
Purpose
Increasing the carrying
capacity of cars up to 25 tons per axle is considered as one of the
priority directions of railways development. It is estimated that
the productivity of such cars is higher by 7-10% due to
increased inter-repair mileage and reduced traction costs assuming
transportation of one ton of cargo. But a heavier car wears the
track more intensely [9].
In order
to solve the problem issues, the authors of the article aim to
analyse the changes in the state of the geometric parameters of the
railway track, depending on the passed tonnage in dynamic
interaction with the rolling stock, the axle load of which is 25
tf/axle.
Methodology
The work was carried
out by the employees of the Track and Track Facilities Department
and the Track-Testing Branch Research Laboratory, which is
accredited as part of the testing center of the DNURT (accreditation
certificate of NAAU No. 2N0011).
These
tests were
carried out
in accordance
with the
program and
methodology of
conducting tests
of impact
on the
track of
the 25 tf/axle
load rolling
stock,
heavy-duty
trains. In
order to obtain statistical data, the
program envisaged assessing the impact of cars with an axle load of
25 tf/axle on the state of the geometric parameters of the railway
track, as well as comparing them with the
projections.
Statistical
surveys were conducted on a single-gauge section of r.st. Ukrainska
– r.st. Kakhovske Sea (PCh-4 Melitopol, regional branch of
«Prydniprovska Railways»). The section
is one-track railway, of the V-VI track category. With the
density of freight traffic G = 5.5 million
tons km gross / km per year, the tonnage passed during the
observation period is 225 million tons gross. The
station
Dniprorudne is
located on
the section.
Given
that from
the side
of railway
station
Kakhovske Sea
to the
railway station
Dniprorudne all
cars go
with a
load of
23.5 tf/axle,
and from
r.st.
Dniprorudne to
r.st.
Ukrainska –
tested cars
with load
of up to
25 tf/axle,
two test
sections were considered
separately:
1)
From 30 to
22 km of
the block
r.st. Kakhovske
Sea – r.st. Dniprorudne, rolling stock with axial load of up to
23.5 tf/axle.
2)
From 20 to
3 km of
the block
r.st.
Dneprroudne –
r.st.
Ukrainska,
rolling stock
with 25
tf/axle
load [3].
Equipping of track
measuring means and track facilities with modern computer technology
can significantly improve methods for assessing the geometry of rail
track and expand the range of practical problems solved by these
methods.
As it is known, for
estimating the track state and planning the track work, some
European railways use the mean square deviation (MSD) of the track
geometric parameters (TGP) and the forecasts of their changes. For
example, this practice is adopted at the railways of Austria, Great
Britain, the Netherlands, and others [10].
MSD is the most common
index of dispersion of the random variable values relative to its
mathematical expectation.
MSD shows how much the
average value of a characteristic deviates from its average
value.
Since the magnitude of
MSD characterizes the deviation of the track across the entire
considered front, it allows us to estimate the actual state of the
track on the experimental section [9].
In this case, a linear
model is used that describes the variability of the MSD of TGP
depending on the tonnage passed along the track section.
The mean square
deviation is always greater than the mean linear deviation.
A
small value of the mean square deviation indicates that these points
are closer to the mean (mathematical expectation) of the sample,
while large values of the standard deviation indicate that the
points are distributed in a wider range of values.
The practical use of
MSD for data sampling is to estimate the magnitude of how much they
deviate from the mean value.
The initial data used
for the studies of the actual track state with the help of MSD of
TGP were the results of measurements of the track state by KVL-P
railroad cars.
In our
studies, for this purpose, we obtained copies of the electronic
files with the records of the results of the track-measuring car
passage along some sections of the Pridniprovska Railways.
The
TGP MSD calculation
program is
developed at
the Track
and Track
Facilities
Department of
DNURT in
MS Excel.
This program
allows you
to evaluate
the MSD
of the track
geometrical parameters
within the
experimental
sections.
Converting the
records of
track-measuring
cars we
obtained a
tabular data
on six
geometric
indicators of
the track
state (pocket
of the
left and
right lines,
position in
plan of
the left
and right
lines, pattern,
level) [8].
Information on
each indicator
was considered
at intervals
of approximately
1.84 m.
Findings
In order to analyze the
track state according to the proposed method, all records of the
track-measuring car for April – November 2018 are processed. Each
electronic file is recognized and included in a document with the
name of the sheet, which corresponds to the month and year.
The track state
indicators for April 2018 on the 1st section are shown in Fig. 1
Fig. 1.
Explanation of electronic file
for April 2018 (2018_04)
Taking into account the
lack of accuracy, when binding the measurement commencement to the
distance in kilometers, at first all records (for each month) were
adjusted in such a way that the initial base would coincide.
Also,
taking into
account that
during
measurements a
slip of
a measuring
wheel can
occur, the
given step (1.84 m) may differ from the actual one in different
trips. This step in the data for each month of observations was also
corrected (Fig.2).
Fig .2.
Non-coincidence of highs
at the end of the section
According to the
proposed method, all records of the track-measuring car for April –
November 2018 were processed. The information for each month was
stored in a separate sheet MS EXEL with the sheet name corresponding
to the month and year.
For
each value
of the
indicator its
deviation from
the mobile
mean value
was calculated
(Fig. 3).
Fig. 3. Dependence
of horizontal forces
on running speed
Upon
defining the MSD of all parameters for each kilometer of each
section, we built the consolidated tables and the charts of MSD
change by the passed tonnage (monthly data tied to the passed
tonnage).
The
deviation of a certain value from the middle line was found by
approximating the values located at a distance of 50 meters before
and after this value. Approximation is carried out according to the
polynomial of the second order.
After
composing the equations, we constructed the mean square deviation
graphs. The graphs are shown in Figures 4.
To sum up
these figures, the mean value is given, determined by the formula:
 (1)
(1)
where L
– level
in mm; RL–
right levelling
in mm;
LL–
left levelling
in mm;
RP–
right pocket in mm; LP–
left pocket in mm; P
–pattern in
mm.
Samples of MSD changes
are depicted in Figure 3. The graphs show the equations of the trend
lines, which determined the intensity of the change in MSD for the
test period for each kilometer.
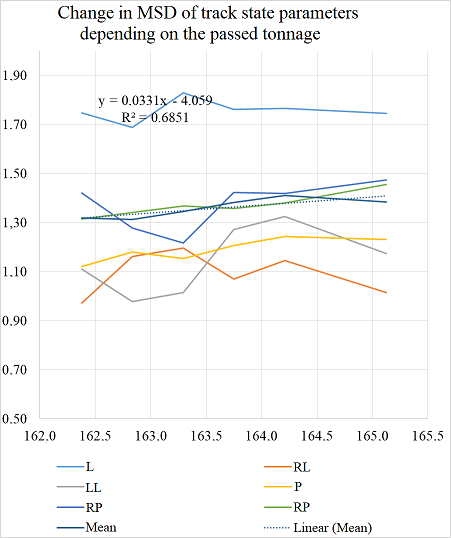
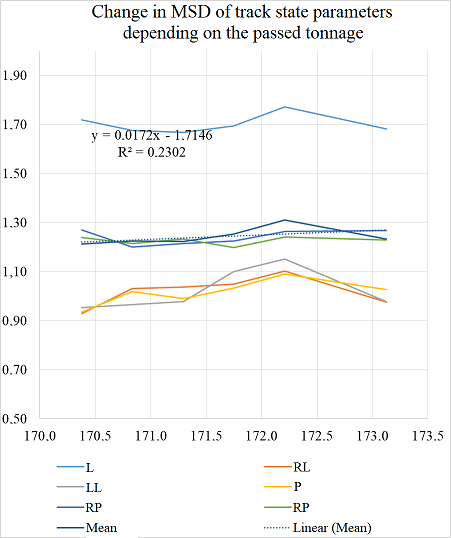
Fig. 4.
Change in mean square deviation on the section of 22-30 km
(23.5 t/axle) and 3-18 km (25 t/axle)
Upon determining the
intensity of the change in MSD of TGP depending on the passed
tonnage in the sections of r.st. Kakhovske Sea – r.st. Ukrainska,
by means of factor dispersion analysis we estimated the influence of
the axial load on the intensity of track state changes [7].
From the charts it is
seen that the intensity increases by 20%, therefore one can conclude
that the axial load affects the state of track geometric parameters.
But given the significant spread of these values, we conducted the
factor analysis.
To do this, all the
received intensities (for kilometers) are divided separately for
sections 1 (up to 23.5 t/axle) and 2 (up to 25 t/axle). Output data
and the results of the conducted factor analysis are presented in
Fig. 4.
The factor dispersion
analysis confirmed that, with a probability of 0.95, it cannot be
asserted that during the observation period, the axial load affected
the intensity of the growth of track irregularities.
It should be noted that
with the density of freight traffic along the section of 5.5 million
tkm/km per year, during the period of observations (April-October
2018) 5.5/12*6 = 2.75 million tons of cargo was passed, while the
cars with an axial load of up to 25 t/axle transported about 3 ths.
tons, which was about 0.1 per cent.
It should also be noted
that according to Fig. 3, the average intensity of the growth of
track irregularities on the sections with axial load up to 23.5 t
was 0.0144 mm/m.t, while on the sections with axial load up to 25 tf
– 0.0172 mm/m.t.
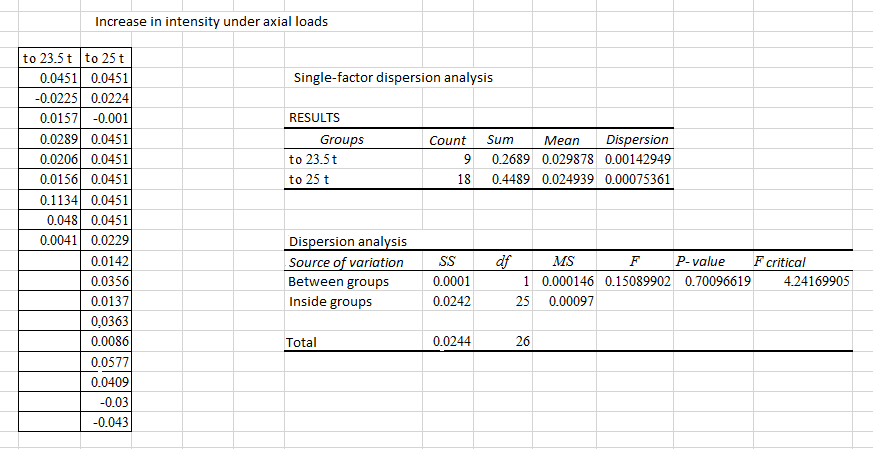
Fig. 5. Factor dispersion
analysis of impact of 25 t/axle load cars on the intensity of track
deterioration increase
Originality and practical value
The research was
conducted for the possibility of estimating the impact of cars with
25 t/axle load on the state of geometrical parameters of the railway
track and suggested the ways of solving the issue of introducing the
25 t/axle load rolling stock in Ukraine.
Conclusions
Having
performed the analysis of the change in MSD of TGP depending on the
density of freight traffic, the passed tonnage and the repairs,
having obtained the general mean adjusted value in the sections of
r.st. Ukrainska – r.st. Kakhovske Sea before and after the
modernization, we see that the general mean adjusted value of MSD of
TGP on the track sections Ukrainska – Kakhovske Sea is equal to
1.62 mm.
We
analysed the changes of the MSD of TGP depending on the density of
freight traffic on the track sections Ukrainska – Kakhovske Sea
and made the conclusion that at the same volume of the passed
tonnage the value of the freight traffic density does not affect the
value of the MSD of TGP.
The
obtained MSD of TGP allow to give an assessment of the track state
and to plan the performance of track work, including track repair
with greater efficiency than by the existing norms. Before and after
the repairs, it would be advisable to carry out the analysis of the
MSD of TGP and to further assess the track state and plan the track
repair in accordance with this method according to the actual state
of the track.
Thus, we
can conclude that in order to obtain the MSD in both direct and
circular curves and ease curves, the basic value for determining
deviations can be found by approximating the actual values by the
second order polynomial.
With
the continuous
introduction of
25-t/axle
load cars,
the track
maintenance cost
will increase
by 6-8%. We
recommend the
corresponding
reduction of
inter-repair
periods, which
corresponds to
the standards
stipulated [7].
LIST OF REFERENCE LINKS
Вериго,
М. Ф.
Взаимодействие пути и подвижного
состава /
М. Ф. Вериго,
А. Я.
Коган.
– Москва
: Транспорт,
1986.
– 559
с.
Влияние
высоких осевых нагрузок на режим работы
пути // Железные дороги. ИССО транспортных
магистралей
:
Экспресс-информация.
– Москва
: ВИНИТИ.
– 1990.
– № 43.
– С.
16–18.
Патласов,
А. М. Влияние
осевой нагрузки, вида промежуточных
ремонтов пути и сроков их проведения
на сопротивление движению подвижного
состава / А. М. Патласов // Исследование
взаимодействия пути и подвижного
состава : межвуз. сб. науч. тр. / Днепропетр.
ин-т инжен. ж.-д. трансп. – Днепропетровск,
1991. – Вып. 283/32.
– С. 39–45.
Интенсивность
накопления остаточных деформаций пути
при воздействии вагонной нагрузки
250 Кн/ось / С. В. Амелин, М. П. Смирнов,
Л. И. Блажко, В. И. Смирнов. – Ленинград
: Ленингр. ин-т инжен. трансп, 1982. – 73 с.
Метрологія
та стандартизація в теплоенергетиці
[Electronic
resource]
: підручник / уклад. Кєсова
Л. О., Промоскаль В. І., Червоний В. В. –
Електронні текстові дані. –
Київ : КПІ ім. Ігоря Сікорського, 2018. –
451 с.
–
Available
at:
https://bitly.su/
– Title
from the screen.
– Accessed
: 06.06.2019.
Патласов,
А. М. Совершенствование системы
планирования ремонтов железнодорожного
пути : дис.
… канд. техн. наук :
05.22.06 / Александр Михайлович
Патласов ; Петербург.
ин-т инж.
ж.-д. трансп.
– Санкт-Петербург, 1991. – 167
с.
Положення
про проведення планово-запобіжних
ремонтно-колійних робіт на залізницях
України : ЦП-0287 : затв.
наказом Укрзалізниці від 03.11.2014 №
470-ЦЗ / А. Бабенко, Г.
Линник, К. Мойсеєнко [та ін.]. – Київ,
2015. – 45 с.
Директива
(ЄС) 2016/797 Європейського Парламенту та
Ради від 11 травня 2016 про інтероперабельність
залізничної системи в рамках Європейського
Союзу [Electronic
resource]
// Офіційний Журнал Європейського
Союзу. – 2016. – 61 с. – Available
at:
http://doszt.gov.ua/content/media/Direktiva-797-UA.pdf
– Title
from
the
screen.
–Accessed :
06.06.2019.
Рыбкин,
В. В. Напряженно-деформированное
состояние пути при взаимодействии
вагонов с повышенной осевой нагрузкой
/ В. В. Рыбкин, А. М. Патласов, В. И. Климов
// Проблемы механики железнодорожного
транспорта. Повышение надежности и
совершенствование конструкций
подвижного состава : тез.
докл. Всесоюз. конф. (Днепропетровск,
май 1988 г.). – Днепропетровск, 1988. –
С. 96.
Технічні
вказівки щодо оцінки стану рейкової
колії за показниками колієвимірювальних
вагонів та забезпечення безпеки руху
поїздів при відступах від норм утримання
рейкової колії : ЦП-0267. – Київ :
Поліграфсервіс, 2012. – 40 с.
Уманов,
М. И. Совершенствование оценки состояния
пути с использованием среднеквадратических
отклонений его геометрических параметров
/ М. И. Уманов, А. М. Патласов // Вісн.
Дніпропетр. нац. ун-ту залізн. трансп.
ім. акад. В. Лазаряна. –
Дніпропетровськ,
2012. – Вип. 40. – С. 109–114.
Эсвельд,
К. Планирование путевых работ с
применением ЭВМ / К. Эсвельд // Железные
дороги мира. – 1991. – № 1. – С. 45–47.
Шахунянц,
Г. М. Нагрузки, скорости,
грузонапряженность, путь / Г. М. Шахунянц
// Труды МИИТ. – 1973. – Вып. 443. – С. 3–97.
Increasing
axle load in Europe State of the art and perspectives [Electronic
resource] / I. Korpanec, E.
Rebeyrotte, M. Guigon, L. Tordai // 8th International Heavy Haul
Conference, 2005. – Available at: https://u.to/sd26FQ – Title
from the screen. – Accessed : 24.05.2019.
Ekberg,
A. Fatigue of railway wheels and rails under rolling contact and
thermal loading – an overview /
A. Ekberg, E. Kabo // Wear. –
2005. – Vol. 258. – Iss. 7-8. – P. 1288–1300.
doi:
https://doi.org/10.1016/j.wear.2004.03.039039
Fischer,
S. Breakage Test of Railway Ballast Materials with New Laboratory
Method / S. Fischer // Periodica Polytechnica Civil Engineering. –
2017. – Vol. 61, No. 4. – Р.
794–802. doi: https://doi.org/10.3311/ppci.8549
Mathematical
Simulation of Spatial Oscillations of the «Underframe-Track»
System Interaction / I. Klimenko, L. Černiauskaite, L. Neduzha, O.
Оchkasov // Intelligent Technologies in
Logistics and Mechatronics Systems,
ITELMS’2018 : The 12th International Conference
(April 26–27, 2018, Panevėžys)
/ Kaunas University of Technology. – Kaunas, 2018. – P.
105–114.
Normalised
curvature square ratio for detection of ballast voids and pockets
under rail track sleepers [Electronic
resource] / S.
Kaewunruen, R.
Janeliukstis, A.
Freimanis, K.
Goto // Journal of Physics:
Conference Series. – 2018. – Vol. 1106. –
Available at:
https://iopscience.iop.org/article/10.1088/1742-6596/1106/1/012002/meta
– Title from the screen. – Accessed : 24.05.2019.
doi:
https://doi.org/10.1088/1742-6596/1106/1/012002
Sandstrom,
A. Predicting crack growth and risks of rail breaks due to wheel
flat impacts in heavy haul operations / J.
Sandström, A.
Ekberg // Proceedings
of the Institution of Mechanical Engineers, Part F: Journal of Rail
and Rapid Transit. –
2009.
– Vol.
223.
– Iss.
2.
– P. 153–161.
doi: https://doi.org/10.1243/09544097jrrt224
Smith,
R. A. The wheel-rail interface – some recent accidents / R.
A. Smith
// Fatigue
& Fracture
of
Engineering
Materials
& Structures.
– 2003. – Vol.
26. – Iss.
10. – P.
901–907.
doi:
https://doi.org/10.1046/j.1460-2695.2003.00701.x
О. М. ПАТЛАСОВ1,
Є. М. ФЕДОРЕНКО2*
1Каф. «Колія
та колійне господарство», Дніпровський
національний університет
залізничного
транспорту імені академіка В. Лазаряна,
вул. Лазаряна, 2, Дніпро,
Україна, 49010,
тел. +38 (056) 373 15 42, ел. пошта
am_patlasov@ukr.net,
ORCID
0000-0003-2081-5648
2*Каф. «Колія та
колійне господарство», Дніпровський
національний університет
залізничного
транспорту імені академіка В. Лазаряна,
вул. Лазаряна, 2, Дніпро,
Україна, 49010,
тел. +38 (066) 868 53 59, ел. пошта
rapunzeeelliza@gmail.com,
ORCID
0000-0002-7518-9106
ВПЛИВ ВАГОНІВ З
ОСЬОВИМ НАВАНТАЖЕННЯМ
25 ТС/ВІСЬ НА СТАН
ЗАЛІЗНИЧНОЇ КОЛІЇ
Мета. Дослідження
спрямоване на визначення змін у стані
геометричних параметрів залізничної
колії залежно від пропущеного тоннажу
за динамічної взаємодії з рухомим
складом із навантаженням 25 тс/вісь.
Методика. Для
досягнення мети автори провели
статистичний аналіз показників
вимірювань стану колії
вагонами-колієвимірювачами типу
КВЛ–П. За допомогою програми розрахунку
середньоквадратичного відхилення
геометричних параметрів колії оцінено
відхилення параметрів у межах дослідних
ділянок. Результати.
За період спостережень виявлено, що
інтенсивність накопичення деформації
колії в середньому зростає. Однак за
результатами факторного дисперсійного
аналізу з ймовірністю 95 % не можна
однозначно стверджувати про вплив
вагонів з осьовим навантаженням до 25
тс/вісь на погіршення показників стану
колії. При цьому слід зазначити, що
частка вантажу, перевезеного у вагонах
з осьовим навантаженням до 25 тс/вісь,
за період спостережень склала менше
одного відсотка. За показниками величини
середньоквадратичного відхилення
оцінено стан геометричних параметрів
колії та їх прогнозні зміни. Аналіз
показав, що підвищення осьового
навантаження призведе до зменшення
ресурсу експлуатації рейок, які є
найдорожчими з елементів верхньої
будови колії, скорочення терміну служби
стрілочних переводів і збільшення
витрат праці робітників, зайнятих
ремонтом і утриманням колії. Рекомендовано
скорочення міжремонтних періодів,
яке відповідає нормативам. Для того,
щоб великовантажні вагони не руйнували
інфраструктуру, має діяти як мінімум
два обмеження: за видами вантажів, які
перевозять, і за швидкістю руху. Наукова
новизна. Автори
провели дослідження
оцінки впливу вагонів з осьовим
навантаженням 25 тс/вісь на стан
геометричних показників залізничної
колії й запропонували шляхи вирішення
питання щодо впровадження в Україні
рухомого складу з осьовим навантаженням
25 тс/вісь. Практична
значимість. На
основі отриманих результатів можна
оцінити вплив осьового навантаження
на інтенсивність змін стану колії та
прогнозувати скорочення міжремонтних
термінів у зв’язку з його погіршенням
і відповідно до обмеження швидкості
руху поїздів.
Ключові слова:
залізнична колія; норми
витрат; напруження; вертикальні й бокові
сили; осьове навантаження
А. М. ПАТЛАСОВ1, Е. М.
ФЕДОРЕНКО2*
1Каф.
«Путь и путевое хозяйство»,
Днипровский национальный
университет
железнодорожного транспорта
имени академика В. Лазаряна, ул.
Лазаряна, 2,
Днипро, Украина, 49010, тел.
+38 (056) 373 15 42,
эл. почта am_patlasov@ukr.net, ORCID
0000-0003-2081-5648
2*Каф.
«Путь и путевое хозяйство»,
Днипровский национальный
университет
железнодорожного транспорта
имени академика В. Лазаряна, ул.
Лазаряна, 2,
Днипро, Украина, 49010, тел.
+38 (066) 868 53 59 ,
эл. почта rapunzeeelliza@gmail.com,
ORCID 0000-0002-7518-9106
ВЛИЯНИЕ ВАГОНОВ С
ОСЕВОЙ НАГРУЗКОЙ
25 ТС/ОСЬ НА СОСТОЯНИЕ
ЖЕЛЕЗНОДОРОЖНОГО
ПУТИ
Цель.
Исследование предусматривает определение
изменений в состоянии геометрических
параметров железнодорожного пути в
зависимости от пропущенного тоннажа
при динамическом взаимодействии с
подвижным составом с нагрузкой 25 тс/ось.
Методика.
Для достижения цели
авторы провели статистический
анализ показателей измерений состояния
пути вагонами-путеизмерителями типа
КВЛ–П. С помощью программы расчета
среднеквадратического отклонения
геометрических параметров оценены
отклонения параметров в пределах
опытных участков. Результаты.
За период наблюдений выявлено, что
интенсивность накопления деформации
пути в среднем возрастает. Однако по
результатам факторного дисперсионного
анализа с вероятностью 95 % нельзя
однозначно утверждать о влиянии вагонов
с осевой нагрузкой до 25 тс/ось на
ухудшение показателей состояния пути.
При этом следует отметить, что доля
перевозимого груза в вагонах с осевой
нагрузкой до 25 тс/ось за период наблюдений
составила менее одного процента. По
показателям величины среднеквадратических
отклонения оценено состояние
геометрических параметров пути и их
прогнозные изменения. Анализ показал,
что повышение осевой нагрузки приведет
к уменьшению ресурса эксплуатации
рельсов, которые являются самым дорогим
элементом верхнего строения пути,
сокращению срока службы стрелочных
переводов и увеличению затрат труда
работников, занятых ремонтом и
содержанием пути. Рекомендовано
сокращение межремонтных периодов,
которое соответствует нормативам. Для
того чтобы большегрузные вагоны не
разрушали инфраструктуру, должны
действовать как минимум два ограничения:
по видам перевозимых грузов и по скорости
движения. Научная
новизна. Авторы провели
исследование для оценки влияния вагонов
с осевой нагрузкой 25 тс/ось на состояние
геометрических показателей железнодорожного
пути и предложили пути решения вопроса
по внедрению в Украине подвижного
состава с осевой нагрузкой 25 тс/ось.
Практическая значимость.
На основе полученных результатов можно
оценить влияние осевой нагрузки на
интенсивность изменений состояния
пути и прогнозировать сокращение
межремонтных сроков в связи с его
ухудшением и в соответствии с ограничением
скорости движения поездов.
Ключевые слова: железнодорожный
путь; нормы расходов; напряжение;
вертикальные и боковые силы; осевая
нагрузка
REFERENCES
Verigo,
M. F., &
Kogan, A.
Y. (1986). Vzaimodeystvie
puti i podvizhnogo sostava.
Moskow: Transport.
(in Russian)
Vliyanie
vysokikh osevykh nagruzok na rezhim raboty puti.
(1990). Zheleznye
dorogi. ISSO transportnykh magistraley: Ekspress-informatsiya,
43, 16-18.
(in Russian)
Patlasov,
A. M. (1991). Vliyanie osevoy nagruzki, vida
promezhutochnykh remontov puti i srokov ikh provedeniya na
soprotivlenie dvizheniyu podvizhnogo sostava. Issledovanie
vzaimodeystviya puti i pod-vizhnogo
sostava, 283(32), 39-45.
(in Russian)
Amelin,
S. V., Smirnov, M. P., Blazhko, L. I., &
Smirnov, V. I. (1982). Intensivnost
nakopleniya ostatochnykh deformatsiy puti pri vozdeystvii vagonnoy
nagruzki 250 Kn/os. Leningrad.
(in Russian)
Kiesova,
L. O., Promoskal, V. I., & Chervonyi, V. V. (2018). Metrolohiia
ta standartyzatsiia v teploenerhetytsi: pidruchnyk.
Kyiv: KPI im. Ihoria Sikorskoho. Retrieved from https://bitly.su/
Patlasov,
A. M. (1991).
Sovershenstvovanie sistemy
planirovaniya remontov zheleznodorozhnogo puti.
(Dysertatsiia kandydata tekhnichnykh
nauk). Petersburg
State Transport University, St.
Petersburg.
(in
Russian)
Polozhennia
pro provedennia planovo-zapobizhnykh remontno-koliinykh robit na
zaliznytsiakh Ukrainy: TsP-0287.
(2015). Kyiv. (in
Ukrainian)
Dyrektyva
(IeS) 2016/797 Yevropeiskoho Parlamentu ta Rady vid 11 travnia 2016
pro interoperabelnist zaliznychnoi systemy v ramkakh Yevropeiskoho
Soiuzu. (2016).
Retrieved from
http://doszt.gov.ua/content/media/Direktiva-797-UA.pdf
(in Ukrainian)
Rybkin,
V. V.,
Patlasov, A.
M.,
& Klimov,
V. I.
(1988).
Napryazhenno-deformirovannoe
sostoyanie puti pri vzaimodeystvii vagonov s povyshennoy osevoy
nagruzkoy,
Problemy mekhaniki zheleznodorozhnogo transporta. Povyshenie
nadezhnosti i sovershenstvovanie konstruktsiy podvizhnogo sostava:
tezisy dokladov Vsesoyuznoy
konferentsii. Dnеpropetrovsk.
(in
Russian)
Tekhnichni
vkazivky shchodo otsinky stanu reikovoi kolii za pokaznykamy
koliievymiriuvalnykh vahoniv ta zabezpechennia bezpeky rukhu
poizdiv pry vidstupakh vid norm utrymannia reikovoi kolii:
TsP-0267. (2012). Kyiv:
Poligrafservis. (in
Ukrainian)
Umanov,
М. І., &
Patlasov, А. М. (2012).
Sovershenstvovanie otsenki sostoyaniya puti s ispolzovaniem
srednekvadraticheskikh otkloneniy ego geometricheskikh parametrov.
Bulletin of Dnipropetrovsk National
University of Railway Transport, 40,
109-114.
(in
Russian)
Essveld,
K. (1991). Planirovanie putevykh rabot s primeneniem EVM. Railways
of the World, 1, 45-47.
(in
Russian)
Shakhunyants,
G. M. (1973). Nagruzki, skorosti, gruzonapryazhennost, put. Trudy
MIIT, 443, 3-97.
(in
Russian)
Korpanec,
I., Rebeyrotte, Е., Guigon, М.,
& Tordai, L. (2005). Increasing
axle load in Europe State of the art and perspectives, 8th
International Heavy Haul Conference, 2005.
Retrieved from https://u.to/sd26FQ
(in English)
Ekberg,
A., & Kabo, E. (2005). Fatigue of railway wheels and rails
under rolling contact and thermal loading
– an overview. Wear,
258(7-8), 1288-1300. doi:
https://doi.org/10.1016/j.wear.2004.03.039039
(in English)
Fischer,
S. (2017). Breakage Test of Railway Ballast Materials with New
Laboratory Method. Periodica
Polytechnica Civil Engineering,
61(4),
794-802. doi:
https://doi.org/10.3311/ppci.8549
(in English)
Klimenko,
І., Černiauskaite, L., Neduzha, L. &
Оchkasov, О.
(2018). Mathematical Simulation of
Spatial Oscillations of the «Underframe-Track» System
Interaction, Intelligent Technologies in Logistics and Mechatronics
Systems, ITELMS’2018. Kaunas. (in English)
Kaewunruen,
S., Janeliukstis, R., Freimanis, A., & Goto, K. (2018).
Normalised curvature square ratio for detection of ballast voids
and pockets under rail track sleepers. Journal
of Physics: Conference Series, 1106.
doi:
https://doi.org/10.1088/1742-6596/1106/1/012002
(in English)
Sandström,
J., & Ekberg, A. (2008). Predicting crack growth and risks of
rail breaks due to wheel flat impacts in heavy haul operations.
Proceedings of the Institution of Mechanical Engineers, Part F:
Journal of Rail and Rapid Transit, 223(2), 153-161.
doi: https://doi.org/10.1243/09544097jrrt224
(in English)
Smith,
R. A. (2003). The wheel-rail interface – some recent accidents.
Fatigue & Fracture of Engineering
Materials & Structures, 26(10), 901-907.
doi: https://doi.org/10.1046/j.1460-2695.2003.00701.x
(in English)
Received:
Jan. 24, 2019
Accepted:
May 23, 2019